
Page 176 - CW E-Magazine (17-12-2024)
P. 176
Special Report
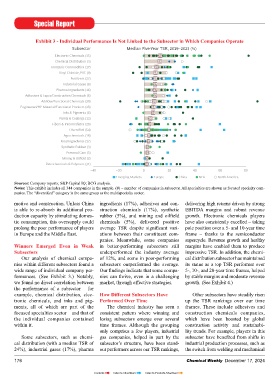
Exhibit 3 - Individual Performance Is Not Linked to the Subsector in Which Companies Operate
Subsector Median Five-Year TSR, 2019–2023 (%)
Electronic Chemicals (35) 25
Chemical Distribution (3) 24
Inorganic Commodities (17) 20
Vinyl Chloride, PVC (9) 18
Fertilizers (27) 18
Industrial Gases (6) 17
Pharma Ingredients (16) 17
Adhesives & Tapes/Construction Chemicals (6) 17
Additive/Functional Chemicals (30) 16
Engineered/HP Material/Functional Products (28) 14
Inks & Pigments (6) 14
Paints & Coatings (12) 10
Fibers & Intermediates (20) 9
Diversified (54) 8
Agrochemicals (16) 8
Food Ingredients (17) 7
Synthetic Rubber (3) 5
Personal Care (5) 5
Mining & Oilfield (3) 5
Petrochemicals & Polymers (31) 4
–40 –20 0 20 40 60 80
Emerging Markets Europe China NEA North America
Sources: Company reports; S&P Capital IQ; BCG analysis.
Notes: This exhibit includes all 344 companies in the sample. (#) = number of companies in subsector. All specialties are shown as focused specialty com-
panies. The “diversifi ed” category is the same group as the multispecialty sector.
motive and construction. Unless China ingredients (17%), adhesives and con- delivering high returns driven by strong
is able to re-absorb its additional pro- struction chemicals (17%), synthetic EBITDA margins and robust revenue
duction capacity by stimulating domes- rubber (5%), and mining and oilfi eld growth. Electronic chemicals players
tic consumption, this oversupply could chemicals (5%), delivered positive have also consistently excelled – taking
prolong the poor performance of players average TSR despite signifi cant vari- pole position over a 5- and 10-year time
in Europe and the Middle East. ations between their constituent com- frame – thanks to the semiconductor
panies. Meanwhile, some companies supercycle. Revenue growth and healthy
Winners Emerged Even in Weak in better-performing subsectors still margins have enabled them to produce
Subsectors underperformed the industry average impressive TSR. In addition, the chemi-
Our analysis of chemical compa- of 12%, and some in poor-performing cal distribution subsector has maintained
nies within different subsectors found a subsectors outperformed the average. its status as a top TSR performer over
wide range of individual company per- Our fi ndings indicate that some compa- 5-, 10-, and 20-year time frames, helped
formances. (See Exhibit 3.) Notably, nies can thrive, even in a challenging by stable margins and moderate revenue
we found no direct correlation between market, through effective strategies. growth. (See Exhibit 4.)
the performance of a subsector – for
example, chemical distribution, elec- How Different Subsectors Have Other subsectors have steadily risen
tronic chemicals, and inks and pig- Performed Over Time up the TSR rankings over our time
ments, all of which are part of the The chemical industry has seen a frames. These include adhesives and
focused specialties sector – and that of consistent pattern where winning and construction chemicals companies,
the individual companies contained losing subsectors emerge over several which have been boosted by global
within it. time frames. Although the grouping construction activity and sustainabi-
only comprises a few players, industrial lity trends. For example, players in this
Some subsectors, such as chemi- gas companies, helped in part by the subsector have benefi ted from shifts in
cal distribution (with a median TSR of subsector’s structure, have been stand- industrial production processes, such as
24%), industrial gases (17%), pharma out performers across our TSR rankings, the switch from welding and mechanical
176 Chemical Weekly December 17, 2024
Contents Index to Advertisers Index to Products Advertised