Latest Chemical Industry
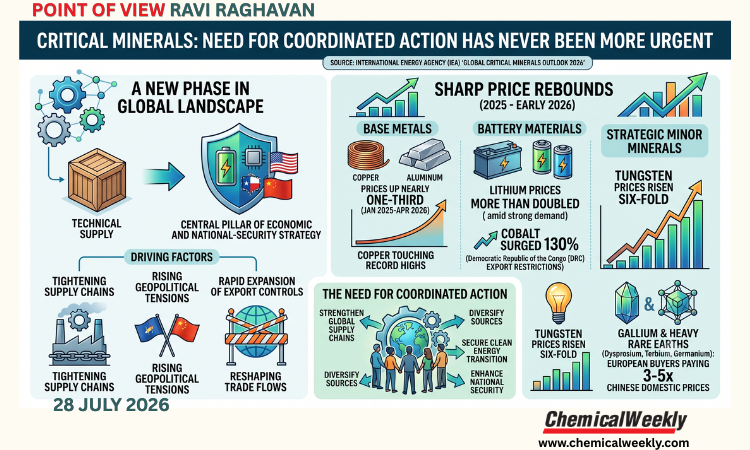


Critical minerals: Need for coordinated action has never been more urgent

 31 July, 2026 16:34:11 IST
Aether Industries, Dow India launch joint research programme on silicone manufacturing technology
Surat-based speciality chemicals firm and contract research and manufacturing services (CRAMS) provider, Aether Industries Ltd., has announced a collaborative...
31 July, 2026 16:24:01 IST
Shivtek Spechemi acquires land in Ankleshwar for setting up chemicals manufacturing hub
Shivtek Spechemi Industries Ltd, a leading speciality chemicals manufacturer and flagship company of the Shiva Group of Industries,...
31 July, 2026 16:22:58 IST
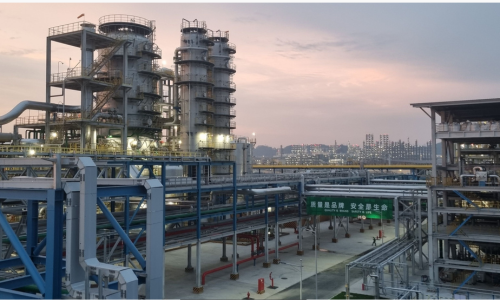
Odisha begins land acquisition for IOC’s Paradip petrochemical complex
The Odisha government has initiated land acquisition for Indian Oil Corporation (IOC)’s mega petrochemical complex in Paradip, marking...

31 July, 2026 16:21:48 IST
AARAV opens fragrance creation centre in Thane
AARAV Fragrances & Flavors Pvt. Ltd., one of India’s leading fragrance, flavour and ingredient houses, has launched The...

31 July, 2026 16:20:44 IST
DKSH enters exclusive distribution agreement with Galaxy Surfactants in Europe
DKSH’s Business Unit Performance Materials, a leading distributor of specialty chemicals and ingredients, has signed an exclusive distribution...
31 July, 2026 16:19:46 IST
Indo Amines’ Vadodara plant ordered shut by GPCB
Indo Amines has received a closure direction from Gujarat Pollution Control Board (GPCB) for its Vadodara plant due...
31 July, 2026 16:18:52 IST
China’s Fuhua Chemical commences operations at Evonik-licensed hydrogen peroxide mega plant
Production has begun at the new hydrogen peroxide megaplant operated by China’s Fuhua and licensed by...
31 July, 2026 16:17:44 IST
Symrise inks deal to acquire France-based Floral Concept
Germany’s fragrance and flavours maker, Symrise, said it has signed a “put option agreement” to acquire...
31 July, 2026 16:15:22 IST
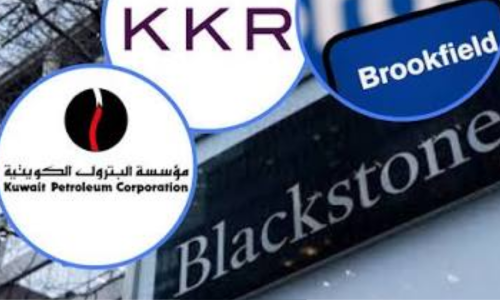
Kuwait Oil Company inks $16-bn pipeline lease deal with Blackstone-Brookfield-KKR consortium
Kuwaiti national oil company, Kuwait Petroleum Corporation (KPC), has announced that its wholly-owned subsidiary Kuwait Oil Company (KOC)...
.png)
31 July, 2026 16:11:32 IST
US-Saudi consortium close to finalising site for $5-bn Gulf refinery
A consortium of US and Saudi Arabian companies, MERA Oil, has entered the final stage of...

30 July, 2026 15:57:57 IST
The quiet bottleneck behind every OLED Screen: Why 4,4'-diiodobiphenyl deserves more attention than it gets
Akshay Arora, Director of SARA R&D Centre, explains why 4,4'-diiodobiphenyl (DIBP) is a...

30 July, 2026 15:54:52 IST
Filiform corrosion – Causes, appearance, detection, and prevention
Dr. S.K. Chakravorty details how filiform corrosion (FFC) undermines coated metals like aluminium,...
PRINT EDITION

Jul 28, 2026
View Digital Issue
Download Issue
View Past Issues
Search For
Exhibitions & Conferences


Watch


OTHER PUBLICATIONS

DATABASES