Latest Chemical Industry
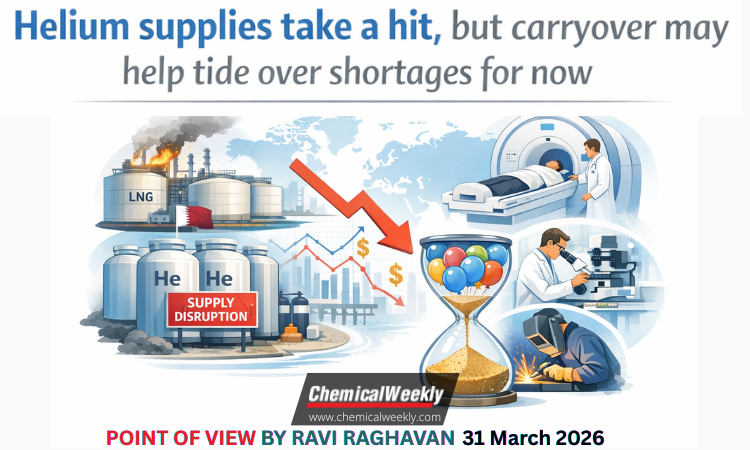


Helium supplies take a hit, but carryover may help tide over shortages for now
 31 March, 2026 17:22:35 IST
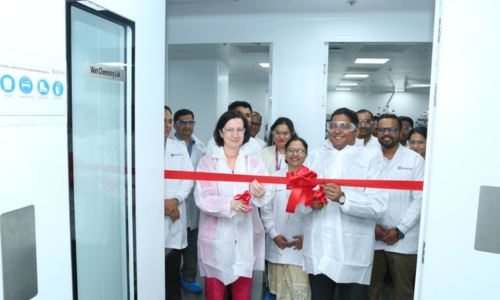
Evonik adds analytics capabilities at Thane research hub
The Indian arm of German speciality chemicals major Evonik, has inaugurated a new Research, Development & Innovation (RDI)...
31 March, 2026 17:21:48 IST
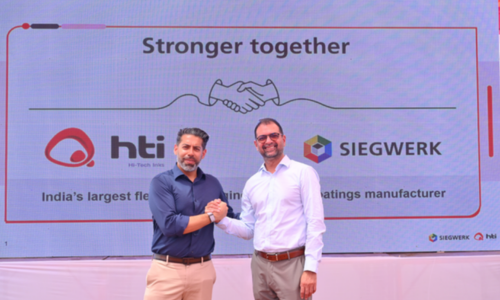
Siegwerk to bolster packaging inks presence with acquisition of Hi-Tech Inks
Siegwerk, a Germany based firm specialising in printing inks and coatings for packaging and labelling, has agreed to...
31 March, 2026 17:20:24 IST
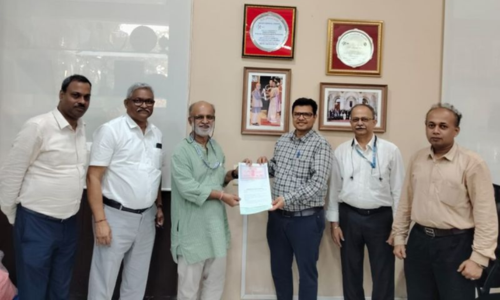
Amar Equipment to co-develop SC carbon dioxide dyeing technology with ICT
Amar Equipment Pvt. Ltd. (AEPL), a leading supplier of process technology solutions and equipment, has signed a Memorandum...
31 March, 2026 17:16:38 IST
QCO on linear alkyl benzene suspended temporarily
The Ministry of Chemicals & Fertilizers has issued a notification on March 30, temporarily suspending the quality control...
31 March, 2026 17:14:56 IST
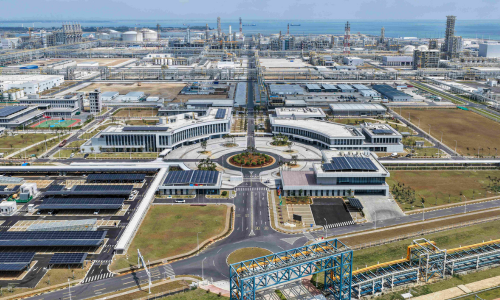
BASF officially unveils Verbund site in China
German chemicals giant, BASF, celebrated the official inauguration of its newly built Verbund site in Zhanjiang, Guangdong...

31 March, 2026 17:13:48 IST
Chemicals regulation, competitiveness and sustainability to take centre stage at Helsinki Chemicals Forum
The 17th Helsinki Chemicals Forum 2026, set to be held at a time when Europe’s chemicals and metals...
31 March, 2026 17:12:52 IST
Symrise carves out new Care & Wellness division from its Scent & Care business
Symrise, the German supplier of fragrances, flavours and food ingredients, has set up a new ‘Care & Wellness’...
31 March, 2026 17:11:57 IST
Citromax acquires Medallion Fragrance and launches innovation centre
Citromax Group, a US-based lemon oil processing firm, has acquired Medallion Fragrance. The acquired division will now operate...

31 March, 2026 17:11:16 IST
Fujitsu and The University of Osaka develop new technologies for chemical material energy calculations on early-FTQC quantum computers
Fujitsu, a Japanese information and communication technology company, and the Centre for Quantum Information and Quantum Biology at...
27 March, 2026 16:14:52 IST
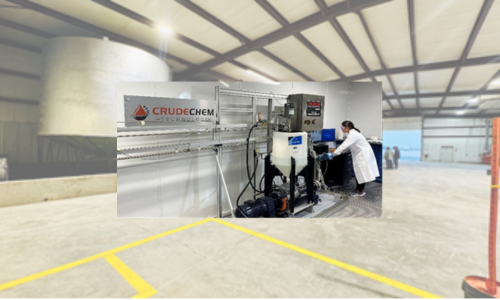
Fineotex Chemical-owned CrudeChem expands US footprint with 15-acre facility in Midland
CrudeChem Technology, the US-based oilfield chemicals firm acquired by Mumbai-based speciality chemicals firm, Fineotex Chemical Ltd (FCL) in...
27 March, 2026 16:13:50 IST
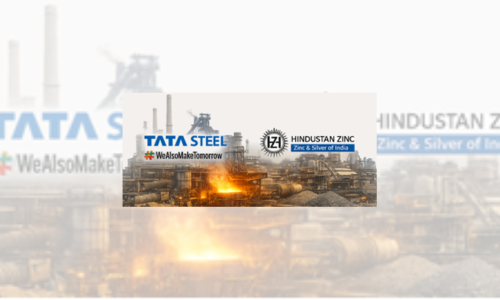
Hindustan Zinc and Tata Steel to jointly scale low-carbon zinc solutions with EcoZen
Hindustan Zinc Ltd (HZL), the world’s largest integrated zinc producer, has strengthened its long-standing association with Tata Steel...

27 March, 2026 16:12:43 IST
PVC summit & exhibition, Vinyl India 2026, to be held in Mumbai on 9-10 April
The 13th Vinyl India 2026, a large gathering of PVC industry stakeholders, organised by ElitePlus++ Business Services, is...
PRINT EDITION

Mar 31, 2026
View Digital Issue
Download Issue
View Past Issues
Search For
Exhibitions & Conferences


Watch


OTHER PUBLICATIONS

DATABASES