
Page 192 - CW E-Magazine (27-2-2024)
P. 192
Special Report
Table 2: Corrosion condition related with half-cell potential measurements sibility of corrosion. Various condition
OCP values OCP values Corrosion condition survey assessments have been made
(Mv vs SCE) (Mv vs CSE) using this technique(11).
< - 426 < -500 Severe corrosion Concrete resistivity measurement
< - 276 < -350 High (90% risk of corrosion) The electrical resistivity of concrete
-126 to -275 - 350 to - 200 Intermediate corrosion risk is an important parameter concerning
>- 125 > -200 Low (10% risk of corrosion) determination of intensity of corrosion
initiation. In concrete with high elec-
gram for OCP measurements is shown Surface Potential (SP) measurements trical resistivity the corrosion process
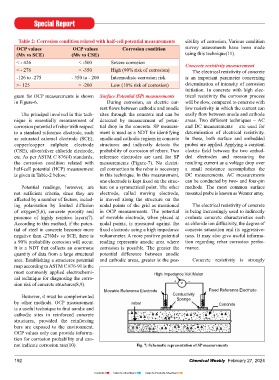
in Figure-6. During corrosion, an electric cur- will be slow, compared to concrete with
rent flows between cathodic and anodic low resistivity in which the current can
The principal involved in this tech- sites through the concrete and can be easily flow between anode and cathode
nique is essentially measurement of detected by measurement of poten- areas. Two different techniques – AC
corrosion potential of rebar with respect tial drop in the concrete. SP measure- and DC measurements – are used for
to a standard reference electrode, such ment is used as a NDT for identifying determination of electrical resistivity.
as saturated calomel electrode (SCE), anodic and cathodic regions in concrete In these, both surface and embedded
copper/copper sulphate electrode structures and indirectly detects the probes are applied. Applying a constant
(CSE), silver/silver chloride electrode, probability of corrosion of rebars. Two electric field between the two embed-
etc. As per ASTM C 876(4) standards, reference electrodes are used for SP ded electrodes and measuring the
the corrosion condition related with measurements (Figure-7). No electri- resulting current as a voltage drop over
half-cell potential (HCP) measurement cal connection to the rebar is necessary a small resistance accomplishes the
is given in Table-2 below: in this technique. In this measurement, DC measurements. AC measurements
one electrode is kept fixed on the struc- can be conducted by two- and four-pin
Potential readings, however, are ture on a symmetrical point. The other methods. The most common surface
not sufficient criteria, since they are electrode, called moving electrode, mounted probe is known as Wenner array.
affected by a number of factors, includ- is moved along the structure on the
ing polarisation by limited diffusion nodal points of the grid as mentioned The electrical resistivity of concrete
of oxygen(5,6), concrete porosity and in OCP measurements. The potential is being increasingly used to indirectly
presence of highly resistive layers(7). of movable electrode, when placed at evaluate concrete characteristics such
According to this method, if the poten- nodal points, is measured against the as chloride ion diffusivity, the degree of
tial of steel in concrete becomes more fixed electrode using a high impedance concrete saturation and its aggressive-
negative than -276Mv vs SCE, there is voltammeter. A more positive potential ness. It may also give useful informa-
a 90% probability corrosion will occur. reading represents anodic area where tion regarding rebar corrosion perfor-
It is a NDT that collects an enormous corrosion is possible. The greater the mance.
quantity of data from a large structural potential difference between anodic
area. Establishing a structures potential and cathodic areas, greater is the pos- Concrete resistivity is strongly
map according to ASTM C 876-91 is the
most commonly applied electrochemi- High Impedance Volt Meter
cal technique for diagnosing the corro- + –
sion risk of concrete structures(8,9). v
Movable Reference Electrode Fixed Reference Electrode
However, it must be complemented Conductivity
by other methods. OCP measurement rebar Sponge Concrete
is a useful technique to find anodic and
cathodic sites in reinforced concrete
structures, provided the reinforcing
bars are exposed to the environment.
OCP values only can provide informa-
tion for corrosion probability and can-
not indicate corrosion rate(10). Fig. 7: Schematic representation of SP measurements
192 Chemical Weekly February 27, 2024
Contents Index to Advertisers Index to Products Advertised