
Page 185 - CW E-Magazine (26-3-2024)
P. 185
Special Report Special Report
climate-friendly plastics industry. Bio- based structural polymers are composed shown. Additionally, biodegradable
degradability is offered by almost the half of the polymers that will later form the bio-based polymers are highlighted
of the produced bio-based polymers. structural mass of the fi nished plastic with a green dot. The different bio-
This should only be a solution for plas- part, and amounting together to 4.5-mt. based polymer groups are subject to
tics that cannot be collected and enter On the other hand, the total amount of different market dynamics. While
the environment. In these situations, bio based functional polymers consists drop-ins have direct fossil-based
they can biodegrade without leaving of bio-based functional polymers and counterparts and can substitute
behind microplastics. Only two coun- paper starch, yielding 13.7-mt. Besides them, the dedicated ones have new
tries, Italy and Austria politically sup- these two groups with up to 18.2-mt properties and functionalities that
port this additional disposal path. of bio-based functional and structural petrochemistry does not provide.
polymers, rubber products and man Both have their own advantages and
If bio-based polymers were to be made fi bres can also be bio-based. In disadvantages from a production and
accepted as a solution and promoted in a total, 14-mt of rubber products and market perspective.
similar way as biofuels, annual growth 7.2-mt of man made fi bres are from bio
rates of 20% and more could be ex- based resources, 50% and 8%. While bio based drop in chemi-
pected. The same would apply, should cals are bio-based versions of existing
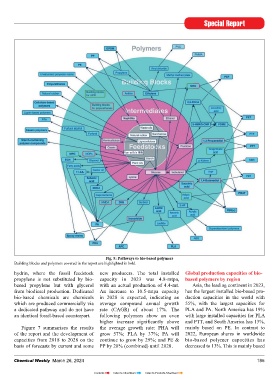
the oil price rise signifi cantly. Based on Figure 5 shows all (semi-)commer- petro-chemicals, which have establi-
the already existing technical maturity cial pathways from biomass via diffe- shed markets and are chemically
of bio-based polymers, considerable rent intermediates and building blocks to identical to existing fossil-based Non edible Milk
market shares could be gained in these bio-based polymers. Bio-based building chemicals, smart drop-in chemicals
cases. blocks and polymers analysed in are a special sub-group of drop-in
detail within the report are highlighted in chemicals. Even though they are
Bio-based polymers – the highlights bold. chemically identical to existing
The global polymer market includes chemicals based on fossil hydro-
functional and structural polymers, Figure 6 shows the different carbons, their bio-based pathways
rubber products as well as man made pathways of bio-based “drop in”, provide signifi cant process advantages
fi bres (Figure 4). “smart drop in” and “dedicated” compared to the conventional path-
inputs within the chemical produc- ways. Additionally, these bio-based
This report focuses on the bio-based tion chain. For each group, certain pathways can be built on completely
share of the structural polymers. Bio- bio-based polymers are exemplarily new approaches, such as epichloro-
Fig. 5: Pathways to bio-based polymers
Building blocks and polymers covered in the report are highlighted in bold.
hydrin, where the fossil feedstock new producers. The total installed Global production capacities of bio-
propylene is not substituted by bio- capacity in 2023 was 4.8-mtpa, based polymers by region
based propylene but with glycerol with an actual production of 4.4-mt. Asia, the leading continent in 2023,
from biodiesel production. Dedicated An increase to 10.5-mtpa capacity has the largest installed bio-based pro-
bio-based chemicals are chemicals in 2028 is expected, indicating an duction capacities in the world with
which are produced commercially via average compound annual growth 55%, with the largest capacities for
a dedicated pathway and do not have rate (CAGR) of about 17%. The PLA and PA. North America has 19%
an identical fossil-based counterpart. following polymers show an even with large installed capacities for PLA
higher increase signifi cantly above and PTT, and South America has 13%,
Figure 7 summarises the results the average growth rate: PHA will mainly based on PE. In contrast to
of the report and the development of grow 57%; PLA by 37%; PA will 2022, European shares in worldwide
capacities from 2018 to 2028 on the continue to grow by 29%; and PE & bio-based polymer capacities has
Fig. 4: Polymers and bio-based shares worldwide 2020-2023 basis of forecasts by current and some PP by 28% (combined) until 2028. decreased to 13%. This is mainly based
184 Chemical Weekly March 26, 2024 Chemical Weekly March 26, 2024 185
Contents Index to Advertisers Index to Products Advertised