Page 186 - CW E-Magazine (26-3-2024)
P. 186

Special Report                                                                                                                                                                   Special Report


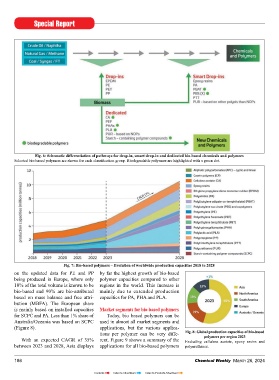
                                                                                                                     covered  in  the  report.  In  2023  fi bres,
                                                                                                                     including woven, non-woven (mainly CA
                                                                                                                     and PTT), had the  highest  share with
                                                                                                                     27%. Packaging, fl exible and rigid, had
                                                                                                                     a 21% share, followed by functional
                                                                                                                     applications with  17% (mainly epoxy
                                                                                                                     resins and PUR), automotive and transport
                                                                                                                     with 10% (mainly PA, epoxy resins and
                                                                                                                     PUR) and consumer goods with 9%
                                                                                                                     (mainly  PA, epoxy resins and PLA).
                                                                                                                     Building and construction had a 6%
                                                                                                                     share (mainly epoxy resins and PUR)
                                                                                                                     and electrics & electronics 5% (mainly
                                                                                                                     epoxy resins and PA). The market seg-
                                                                                                                     ments agri- and horticulture and others
                                                                                                                     had a market share of 2%, respectively.

                                                                                                                     Bio-based and non-biodegradable
                                                                                                                     polymers and biodegradable polymers  Fig. 9: Shares of the produced bio-based polymers in different market segments in 2023
               Fig. 6: Schematic differentiation of pathways for drop-in, smart drop-in and dedicated bio-based chemicals and polymers  Bio-based non-biodegradable poly-  Fibres: including woven and non-woven; Consumer goods: including e.g., coffee capsules, biowaste
       Selected bio-based polymers are shown for each classifi cation group. Biodegradable polymers are highlighted with a green dot.  mers show a CAGR of 13% until 2028   bags, leisure, interieur; Electrics and electronics: including casing; Functional: including adhesives,
                                                                                                                     (Figure 10). Here, the highest growth is   coatings, cosmetics etc.; Others: including fi lms, 3D printing, medical applications, aquaculture.
                                                                                                                     expected for PA with 29%, followed by   Biodegradability  of polymers is  compostable, but only PBSA  bio-
                                                                                                                     PE and PP with 28% (combined). Bio-  completely independent from the  degrades also under home composting
                                                                                                                     based biodegradable polymers show an  resource the polymer is made of, thus  conditions and in soil, according to the
                                                                                                                     even higher growth, with 22%, compared  being bio-based does not necessa-  conditions  defi ned  in  the  established
                                                                                                                     to the overall bio-based polymer growth  rily imply biodegradability  of  certain  standards  and  certifi cation  schemes.
                                                                                                                     of 17% until 2028 (Figure 11). This is  polymers. PBS  and copolymers such  The same is true for PBAT; it is
                                                                                                                     mainly based on high growth rates for  as polybutylene succinate-co-butylene  industrial compostable and, for certain
                                                                                                                     PHA with 57% and PLA with 37%.    adipate (PBSA) are both industrial  grades, also home compostable as well


                          Fig. 7: Bio-based polymers – Evolution of worldwide production capacities 2018 to 2028
       on the updated data for PE and PP  by far the highest growth of bio-based
       being produced in Europe, where only  polymer capacities compared to other
       10% of the total volume is known to be  regions in the  world. This increase  is
       bio-based  and 90% are  bio-attributed  mainly due to extended production
       based on mass balance  and  free  attri-  capacities for PA, PHA and PLA.
       bution (MBFA).  The European share
       is mainly based on installed capacities  Market segments for bio-based polymers
       for SCPC and PA. Less than 1% share of   Today, bio based polymers can be
       Australia/Oceania was based on SCPC  used in almost all market segments and
       (Figure 8).                       applications,  but the various applica-
                                         tions per polymer can be very diffe-  Fig. 8: Global production capacities of bio-based
                                                                                  polymers per region 2023
          With an expected CAGR  of 35%  rent. Figure 9 shows a summary of the   Excluding  cellulose acetate,  epoxy resins and
       between 2023 and 2028, Asia displays  applications for all bio-based polymers   polyurethanes.                             Fig. 10: Bio-based non-biodegradable polymers – Evolution of worldwide production capacities 2018 to 2028

       186                                                                    Chemical Weekly  March 26, 2024        Chemical Weekly  March 26, 2024                                                                 187


                                      Contents    Index to Advertisers    Index to Products Advertised
   181   182   183   184   185   186   187   188   189   190   191