
Page 175 - CW E-Magazine (26-11-2024)
P. 175
Special Report Special Report
How energy costs and overcapacity shape Europe’s ducers. Meanwhile, China’s self-suf- Summary Week-on-week eek-on-week Year-on-yearear-on-year
W
Summary
Y
fi ciency has grown as its capacity ad-
chemical sector outlook ditions continue to outpace demand, Global Index 87.6 0.3% 0.6%
NE Asia Index
3.5%
87.6
0.5%
disrupting global trade fl ows.
6.5%
-0.5%
NW Europe Index
93.6
he global chemical industry is exacerbated by the Russia-Ukraine trade. Imports of polyolefi ns, benzene, US Gulf Index 75.4 -0.3% -19.7%
facing signifi cant challenges, war and energy infl ation. The result is and polystyrene from the US have The EU has shifted from being a net 160
Twith Europe being particularly a weakened European chemical sec- increased, while European exports of exporter of polymers to a net importer.
hard hit by a combination of over- tor, with several companies planning chemicals like methanol, butadiene, Demand for key base chemicals, such 140
capacity, high energy costs and rising shutdowns and restructuring opera- and high-density polyethylene (HDPE) as ethylene and propylene, in Europe
imports from lower-cost regions, leading tions. The once-reliable Verbund model have fallen. This refl ects both the struc- has fallen to its lowest level in 30 years. 120
many companies to shut down opera- is now unravelling, forcing fi rms to tural issues in Europe and the increas- At the recent industry event, EPCA, the Index 100
tions or restructure. rethink their strategies. Despite these ing reliance on imports from regions consensus was that demand in Europe
challenges, there is hope that operating with lower production costs. for 2025 is expected to remain stable, 80
Dow’s decision to place its rates may improve as closures help according to the more optimistic outlook.
European polyurethanes (PU) assets reduce excess capacity. North America, in contrast, has seen However, widespread consolidation, 60
under strategic review underscores a stabilisation in its polymers market now often referred to as rationalisation, 07-Jan-22 04-Feb-22 04-Mar-22 01-Apr-22 29-Apr-22 27-May-22 24-Jun-22 22-Jul-22 19-Aug-22 16-Sep-21 14-Oct-22 11-Nov-22 9-Dec-22 06-Jan-23 03-Feb-23 03-Mar-23 31-Mar-23 28-Apr-23 26-May-23 23-Jun-23 21-Ju1-23 18-Aug-23 15-Sep-23 13-Oct-23 10-Nov-23 08-Dec-23 05-Jan-24 02-Feb-24 01-Mar-24
the urgency, highlighting the pressures Regional disparities after an extended period of destocking. is widely anticipated across the sector.
reshaping Europe’s chemical industry Europe continues to lose its com- The end of this cycle suggests a more
and the need for immediate strategic petitive edge in global chemicals positive outlook for US chemical pro- Economic indicators and forecasts Global Index NE Asia Index NW Europe Index US Gulf Index
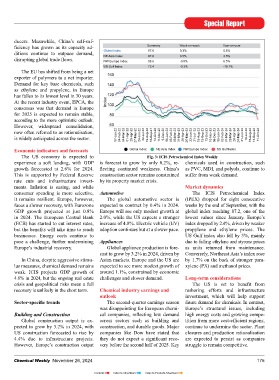
reassessment. While Dow has yet to outline The US economy is expected to Fig. 3: ICIS Petrochemical Index Weekly
specifi c actions, similar reviews across 100 experience a soft landing, with GDP is forecast to grow by only 0.2%, re- chemicals used in construction, such
the industry have often resuled in plant 90 growth forecasted at 2.6% for 2024. fl ecting continued weakness. China’s as PVC, MDI, and polyols, continue to
closures and layoffs. This short quarterly This is supported by Federal Reserve construction sector remains constrained suffer from weak demand.
overview of the key drivers in the global 80 rate cuts and infrastructure invest- by its property market crisis.
chemical markets from ICIS reinforces % of capacity 70 ments. Infl ation is easing, and while Market dynamics
the challenges facing the industry. 60 consumer spending is more selective, Automotive The ICIS Petrochemical Index
it remains resilient. Europe, however, The global automotive sector is (IPEX) dropped for eight consecutive
The European chemicals industry 50 faces a slower recovery, with Eurozone expected to contract by 0.4% in 2024. weeks by the end of September, with the
continues to grapple with signifi cant Jan-20 Mar-20 May-20 July-20 Sep-20 Nov-20 Jan-21 Mar-21 May-21 July-21 Sep-21 Nov-21 Jan-22 Mar-22 May-22 July-22 Sep-22 Nov-22 Jan-23 Mar-23 May-23 July-23 Sep-23 Nov-23 Jan-24 Mar-24 May-24 July-24 GDP growth projected at just 0.8% Europe will see only modest growth at global index reaching 87.2, one of the
challenges in 2024, as it faces macro- Global Capacity Utilisation North America Europe Middle East Northeast Asia in 2024. The European Central Bank 2.0%, while the US expects a stronger lowest values since January. Europe’s
economic disruptions, high energy Global average 1997-2023 (ECB) has started to cut interest rates, increase of 4.8%. Electric vehicle (EV) index dropped by 2.4%, driven by weaker
prices, and persistent overcapacity. but the benefi ts will take time to reach adoption continues but at a slower pace. propylene and ethylene prices. The
Although some sectors show signs of Fig. 1: Regional capacity utilisation rates businesses. Energy costs continue to US Gulf index also fell by 3%, mainly
stabilisation, the outlook for a full PVC Polystyrene PET Resins + Films pose a challenge, further undermining Appliances due to falling ethylene and styrene prices
recovery remains tentative, especially PE PP Total Europe’s industrial recovery. Global appliance production is fore- as units returned from maintenance.
in Europe, where energy volatility and 5 cast to grow by 3.2% in 2024, driven by Conversely, Northeast Asia’s index rose
competitive pressures are eroding the In China, despite aggressive stimu- Asian markets. Europe and the US are by 1.7% on the back of stronger para-
industry’s market position. lus measures, chemical demand remains expected to see more modest growth of xylene (PX) and methanol prices.
2.5 weak. ICIS projects GDP growth of around 1.1%, constrained by economic
Economic and chemical industry 4.8% in 2024, but the ongoing real estate challenges and slower demand. Long-term considerations
overview 0 crisis and geopolitical risks mean a full The US is set to benefi t from
Global chemical production con- recovery is unlikely in the short term. Chemical industry earnings and reshoring efforts and infrastructure
tinues to operate well below capacity. outlook investment, which will help support
ICIS data shows gradual improvements -2.5 Sector-specifi c trends The second-quarter earnings season future demand for chemicals. In contrast,
in capacity utilisation, led by Northeast was disappointing for European chemi- Europe’s structural issues, including
Asia, but Europe lags behind. Europe’s -5 Building and Construction cal companies, refl ecting low demand high energy costs and growing compe-
production has been particularly hard- Global construction output is ex- across sectors such as building and tition from more cost-effi cient regions,
hit by rising energy costs and increased pected to grow by 3.2% in 2024, with construction, and durable goods. Major continue to undermine the sector. Plant
competition from cheaper imports. -7.5 US construction forecasted to rise by companies like Dow have stated that closures and production rationalisation
The region’s chemical capacity utilisa- 2015 2016 2017 2018 2019 2020 2021 2022 2023 4.4% due to infrastructure projects. they do not expect a signifi cant reco- are expected to persist as companies
tion has fallen sharply since mid-2022, Fig. 2: EU27 net polymer exports, mt However, Europe’s construction output very before the second half of 2025. Key struggle to remain competitive.
174 Chemical Weekly November 26, 2024 Chemical Weekly November 26, 2024 175
Contents Index to Advertisers Index to Products Advertised