
Page 178 - CW E-Magazine (12-11-2024)
P. 178
Special Report Special Report
Absolute change in fertilizer use ontribution to gro th from F to F
F to F
A I A I A
illion tonnes nutrients 5 A IA trong support co ers most
2
2
at Am outh Asia Africa A ast Asia orth Am est Asia ceania AF I A countries farmers crops
and fertilizer products.
. . A IA
est ceania est orth ceania orth est A A IA oderate support co ers
Asia Am. Asia some countries farmers
ast Asia Asia Am. crops and fertilizer products.
A
orth outh atin
Am. Asia Am. ast Asia A I A o support co ers fe
ast Asia A
A IA countries farmers crops
A Africa and fertilizer products.
Africa atin atin
Am. outh Am. A IA
A Africa Asia outh
Asia
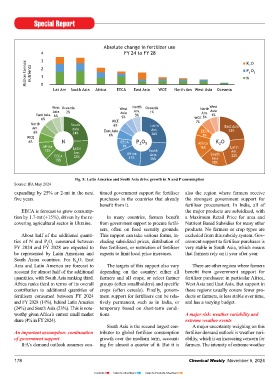
Fig. 6: Regional contribution to fertiliser demand growth
events around the globe has increased in Comparisons to earlier demand The terms nitrogen, phosphate and
Fig. 5: Latin America and South Asia drive growth in N and P consumption recent years. Not all extreme weather outlooks potash are used to denote groups of nutri-
Source: IFA May 2024 events have an impact on agriculture, The decline in fertiliser use expected ent-bearing fertilisers which are produced
expanding by 25% or 2-mt in the next tinued government support for fertiliser also the region where farmers receive and when they do, they do not always in FY 2021 and FY 2022 is smaller than and traded globally. The terms nitrogen,
fi ve years. purchases in the countries that already the strongest government support for affect fertiliser use. The impact of extreme expected in IFA’s November 2024 Short- phosphorous and potassium refer to the
benefi t from it. fertiliser procurement. In India, all of weather events on fertiliser use depends Term Fertiliser Outlook, partly due to nutrients required by plants.
EECA is forecast to grow consump- the major products are subsidized, with on many factors, including the crop area strong government support and the trend
tion by 1.7-mt (+15%), driven by the re- In many countries, farmers benefi t a Maximum Retail Price for urea and affected, the types of crops grown at that reversal in N consumption in China. The Annual periods refer to the calendar
covering agricultural sector in Ukraine. from government support to procure fertili- Nutrient Based Subsidies for many other time, the production system, the stage recovery in FY 2023 and FY 2024 is now year unless stated otherwise, and when FY
sers, often on food security grounds. products. No farmers or crop types are of production, and the intensity of the expected to be stronger than previously precedes a year, it refers to the Fertiliser
About half of the additional quanti- This support can take various forms, in- excluded from this subsidy system. Gov- weather event. As a result, the impact forecast due to improved fertiliser afford- Year. The reference period used to report
ties of N and P O consumed between cluding subsidized prices, distribution of ernment support to fertiliser purchases is of extreme weather events on fertiliser ability. fertiliser consumption varies depending on
2
5
FY 2024 and FY 2028 are expected to free fertilisers, or restriction of fertiliser very stable in South Asia, which means use can be felt at the local, national or the country. Countries report fertiliser con-
be represented by Latin American and exports to limit local price increases. that farmers rely on it year after year. regional level. Moreover, the impact Global fertiliser use is still forecast sumption statistics in 12-month periods
South Asian countries. For K O, East of extreme weather events on fertiliser to experience slowing growth in the that start either in January or in another
2
Asia and Latin America are forecast to The targets of this support also vary There are other regions where farmers use can be two-fold: if agricultural pro- medium-term, but this outlook has stron- month.
account for almost half of the additional depending on the country: either all benefi t from government support for duction is reduced, the resulting loss of ger growth rates than in IFA’s previous
quantities, with South Asia ranking third. farmers and all crops, or select farmer fertiliser purchases: in particular Africa, income for farmers can affect input medium-term outlook, published in June In this report, “fertiliser year” (FY)
Africa ranks third in terms of its overall groups (often smallholders) and specifi c West Asia and East Asia. But support in purchases in the following year. 2023. refers to all 12-month periods. FY 2022
contribution to additional quantities of crops (often cereals). Finally, govern- these regions usually covers fewer pro- refers to the year starting in January 2022
fertilisers consumed between FY 2024 ment support for fertilisers can be rela- ducts or farmers, is less stable over time, Examples of recent extreme weather Notes and defi nitions for most countries in Latin America,
and FY 2028 (14%), behind Latin America tively permanent, such as in India, or and has a varying budget. events having affected fertiliser use in- All volume data presented in this Africa, East and Southeast Asia and
(24%) and South Asia (23%). This is note- temporary based on short-term condi- clude the 2022 fl ood in Pakistan, which report is expressed in nutrient metric EECA. For other regions including North
worthy given Africa’s current small market tions. A major risk: weather variability and prevented mid and late season applica- tonnes unless stated otherwise. Nutrient America, WCE and South Asia, FY 2022
share (4% in FY 2024). extreme weather events tions, the La Niña-driven 2023 drought tonnes refl ect the N, P O and K O con- started in Q2 or mid-2022 and will end in
5
2
2
South Asia is the second largest con- A major uncertainty weighing on this in Argentina that prevented crop planting, tent of nitrogen, phosphate and potash Q2 or mid-2023. Fertiliser years do not
An important assumption: continuation tributor to global fertiliser consumption fertiliser demand outlook is weather vari- and El Niño-caused dryness in Indonesia, fertilisers respectively, rather than the always match crop marketing years used
of government support growth over the medium term, account- ability, which is an increasing concern for which led to lower fertiliser applications physical weight of the product being used to report statistics on crop area, yield and
IFA’s demand outlook assumes con- ing for almost a quarter of it. But it is farmers. The intensity of extreme weather on palm trees. (product tonnes). production.
178 Chemical Weekly November 5, 2024 Chemical Weekly November 5, 2024 179
Contents Index to Advertisers Index to Products Advertised