
Page 176 - CW E-Magazine (12-11-2024)
P. 176
Special Report Special Report
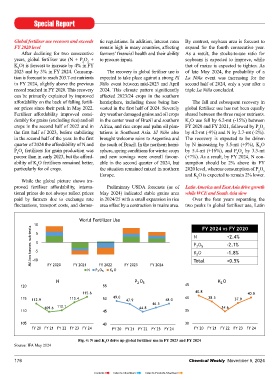
Global fertiliser use recovers and exceeds tic regulations. In addition, interest rates By contrast, soybean area is forecast to America and East Asia are each expec- domestic policies to reduce over-appli- circumstances in recent years: in addi-
FY 2020 level remain high in many countries, affecting expand for the fourth consecutive year. ted to add over 2-mt nutrients to their cation. However, since FY 2021 con- tion to high input prices, weather pat-
After declining for two consecutive farmers’ fi nancial health and their ability As a result, the stocks-to-use ratio for respective consumption. In contrast, West sumption has returned to growth on the terns have been volatile, with either too
years, global fertiliser use (N + P O + to procure inputs. soybeans is expected to improve, while and Central Europe and South Asia are back of a renewed domestic food secu- much rain (Northern Europe) or too little
5
2
K O) is forecast to increase by 4% in FY that of maize is expected to tighten. As forecast to contract their fertiliser use by rity focus and government-implemented (Southern Europe). A severe drought in
2
2023 and by 3% in FY 2024. Consump- The recovery in global fertiliser use is of late May 2024, the probability of a 2-mt and 1.1-mt respectively. Among agricultural subsidies. 2022 was followed by uneven weather
tion is forecast to reach 203.7-mt nutrients expected to take place against a strong El La Niña event was increasing for the smaller consuming regions, Africa is in 2023 and a wet start to 2024. In addi-
in FY 2024, slightly above the previous Niño event between mid-2023 and April second half of 2024, only a year after a forecast to expand its fertiliser use by After dropping in FY 2021, K O con- tion, regulations on the use of N fertili-
2
record reached in FY 2020. This recovery 2024. This climate pattern signifi cantly triple La Niña concluded. 0.5-mt, but Oceania and EECA are ex- sumption in China has also rebounded, sers have recently been implemented in
can be primarily explained by improved affected 2023/24 crops in the southern pected to contract by 0.6-mt and 0.4-mt, supported by improved affordability and some top consuming countries and are
affordability on the back of falling fertili- hemisphere, including those being har- The fall and subsequent recovery in respectively. North America and West continued growth in fruits and vegetable under discussion in others. The expan-
ser prices since their peak in May 2022. vested in the fi rst half of 2024. Severely global fertiliser use has not been equally Asia are forecast to increase consump- production. In parallel, the Chinese gov- sion of organic crop area also continues
Fertiliser affordability improved consi- dry weather damaged grains and oil crops shared between the three major nutrients. tion by less than 200 kt nutrients each. ernment continues to push for improved to reduce mineral fertiliser use.
derably for grains (excluding rice) and oil in the center west of Brazil and southern K O use fell by 6.2-mt (-15%) between K O drives the growth in Latin America effi ciency of fertilisers.
2
2
crops in the second half of 2022 and in Africa, and rice crops and palm oil plan- FY 2020 and FY 2021, followed by P O and the decrease in South Asia, and N FY 2024 to FY 2028: slowing growth
2
5
the fi rst half of 2023, before stabilising tations in Southeast Asia. El Niño also by 4.2-mt (-9%) and N by 2.7-mt (-2%). accounts for most of the consumption India: stronger government support in global fertiliser use, particularly
in the second half of the year. In the fi rst brought welcome rains to Argentina and The recovery is expected to be driven gains in East Asia. In WCE consump- for N and P O leaves K O consump- for N
2
5
2
quarter of 2024 the affordability of N and the south of Brazil. In the northern hemi- by N increasing by 5.5-mt (+5%), K O tion of all three nutrients is expected to tion behind in the short term Global fertiliser use is expected to
2
P O fertilisers for grain production was sphere, spring conditions for winter crops by 5.4-mt (+16%), and P O by 3.3-mt decline. South Asia reduced its fertiliser use continue expanding in the medium-term,
2
5
5
2
poorer than in early 2023, but the afford- and new sowings were overall favour- (+7%). As a result, by FY 2024, N con- between FY 2020 and FY 2024, driven but at a rate decreasing from 2.2% in FY
ability of K O fertilisers remained better, able in the second quarter of 2024, but sumption should be 2% above its FY Latin America: partial recovery in by India which accounts for 80% of 2025 to 1.5% in FY 2028. This is con-
2
particularly for oil crops. the situation remained mixed in northern 2020 level, whereas consumption of P O fertiliser use in FY 23 despite El Niño regional fertiliser use. The reduction was sistent with expectations of improved
2
5
Europe. and K O is expected to remain 2% lower. The expected 8% increase in fertili- predominantly due to lower K O con- nutrient use effi ciency and slowing
2
2
While the global picture shows im- ser use in Latin America between FY sumption. Since 2022, the Indian gov- growth in food production, refl ecting
proved fertiliser affordability, interna- Preliminary USDA forecasts (as of Latin America and East Asia drive growth 2020 and FY 2024 (including a 15% ernment increased its support for P O slowing population growth.
5
2
tional prices do not always refl ect prices May 2024) indicated stable grains area while WCE and South Asia slow drop in FY 2022), mostly refl ects in- fertilisers through Nutrient Based Sub-
paid by farmers due to exchange rate in 2024/25 with a small expansion in rice Over the four years separating the creased agricultural production. Bet- sidies to offset some of the rise in inter- Consumption of P O and K O is
2
2
5
fl uctuations, transport costs, and domes- area offset by a contraction in maize area. two peaks in global fertiliser use, Latin ween crop years 2020/21 and 2024/25, national prices. It also continued to sub- expected to grow faster than N consump-
soybean production in South America sidize urea at a fi xed Maximum Retail tion over the medium-term. Between
is expected to grow by 18% and maize Price, well below international levels. FY 2024 and FY 2028, consumption
orld Fertilizer se
production by 25%, driven largely by Support for K O fertilisers saw minimal growth is forecast at 10% for K O
2
2
illion tonnes nutrients . planted with soybeans, sugarcane and is expected to return to FY 2020 levels Southern regions are driving medium-
additional support in comparison. As a compared to 8% for P O and 6% for N.
area expansion. In Brazil, the larg-
2
5
est fertiliser market in the region, area result, consumption of both N and P O
5
2
.
by FY 2024, but K O consumption is term growth in fertiliser use
cotton increased in 2023/24. In Argen-
2
.
tina, a strong rebound in crop area and expected to remain lower.
Latin America and South Asia are
F
bal growth in the medium term, adding
F
F
La Niña events. In Mexico, government WCE: consumption not recovering
F F otal . yields is expected after three successive expected to be the main engines of glo-
between 3 and 4-mt nutrients each bet-
support for fertilisers (urea and DAP) completely
signifi cantly increased in recent years, West & Central Europe (WCE) is ween FY 2024 and FY 2028. East Asia
offsetting some of the impact of higher expected to reduce its fertiliser use by is expected to expand by only 2% over
. . . international fertiliser prices. 12% or 2-mt nutrients between FY 2020 these four years, but this translates into
. . . . . . . China: partial rebound in N use and FY 2024. Consumption of P O and an additional 1.5-mt nutrients due to its
5
2
large market size.
K O is particularly affected, with re-
2
. . . . . China accounted for 24% of global spective drops of 17% (0.5-mt) and 22%
fertiliser use in FY 2023, and 75% of (0.7-mt). Consumption of N is expected Mature markets such as North America
consumption in East Asia and has re- to decrease by only 7% (0.8-mt). Many and WCE are expected to grow very
F F F F F F F F F F F F F F F cently experienced a trend reversal in its WCE farmers prioritized applications of little, adding respectively 0.8-mt and
fertiliser use. N use in China decreased N to maintain their yields but decreased 0.9-mt to global consumption. Among
Fig. 4: N and K O drive up global fertiliser use in FY 2023 and FY 2024 steadily between FY 2014 and FY 2021, their application of P O and K. Farmers smaller but more dynamic markets,
5
2
2
Source: IFA May 2024 with an average rate of -4%, driven by in WCE have been facing diffi cult Africa is forecast to grow the fastest,
176 Chemical Weekly November 5, 2024 Chemical Weekly November 5, 2024 177
Contents Index to Advertisers Index to Products Advertised