
Page 192 - CW E-Magazine (14-11-2023)
P. 192
Special Report
regulatory and reimbursement issues,
and competitive landscapes.
To understand how the industry is
positioned to meet these product de-
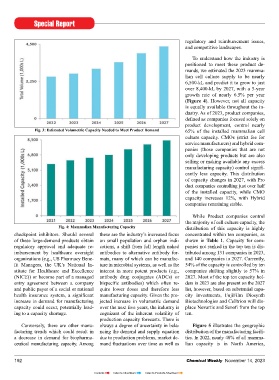
mands, we estimated the 2023 mamma-
lian cell culture supply to be nearly
6,500-kL and predict it to grow to just
over 8,400-kL by 2027, with a 5-year
growth rate of nearly 6.5% per year
(Figure 4). However, not all capacity
is equally available throughout the in-
dustry. As of 2023, product companies,
defined as companies focused solely on
product development, control nearly
Fig. 3: Estimated Volumetric capacity Needed to Meet Product Demand 65% of the installed mammalian cell
culture capacity. CMOs (strict fee for
service manufacturers) and hybrid com-
panies (those companies that are not
only developing products but are also
selling or making available any excess
manufacturing capacity) control signifi-
cantly less capacity. This distribution
of capacity changes in 2027, with Pro
duct companies controlling just over half
of the installed capacity, while CMO
capacity increases 12%, with Hybrid
companies remaining stable.
While Product companies control
the majority of cell culture capacity, the
Fig. 4: Mammalian Manufacturing capacity distribution of this capacity is highly
checkpoint inhibitors. Should several these are the industry’s increased focus concentrated within ten companies, as
of these large-demand products obtain on small population and orphan indi- shown in Table 1. Capacity for com-
regulatory approval and adequate re- cations, a shift from full length naked panies not ranked in the top ten is dis-
imbursement by healthcare oversight antibodies to alternative antibody for- tributed among 131 companies in 2023,
organizations (e.g., US Pharmacy Bene- mats, many of which can be manufac- and 140 companies in 2027. Currently,
fit Managers, the UK’s National In- ture in microbial systems, as well as the 54% of the capacity is controlled by ten
stitute for Healthcare and Excellence interest in more potent products (e.g., companies shifting slightly to 57% in
(NICE)) or become part of a managed antibody drug conjugates (ADCs) or 2027. Most of the top ten capacity hol-
entry agreement between a company bispecific antibodies) which often re- ders in 2023 are also present on the 2027
and public payer of a social or national quire lower doses and therefore less list, however, based on substantial capa-
health insurance system, a significant manufacturing capacity. Given the pro- city investments, FujiFilm Diosynth
increase in demand for manufacturing jected increase in volumetric demand Biotechnologies and Celltrion will dis-
capacity could occur, potentially lead- over the next five years, the industry is place Novartis and Sanofi from the top
ing to a capacity shortage. cognizant of the inherent volatility of ten.
production capacity forecasts. There is
Conversely, there are other manu- always a degree of uncertainty in bala- Figure 5 illustrates the geographic
facturing trends which could result in ncing the demand and supply equation distribution of the manufacturing facili-
a decrease in demand for biopharma- due to production problems, market de- ties. In 2022, nearly 40% of all mamma-
ceutical manufacturing capacity. Among mand fluctuations over time as well as lian capacity is in North America,
192 Chemical Weekly November 14, 2023
Contents Index to Advertisers Index to Products Advertised