
Page 181 - CW E-Magazine (16-7-2024)
P. 181
Special Report Special Report
Indian pharma industry to surpass $70-bn by FY27 FY18 FY24 FY27E 100 to 120 basis points from the pre-
vious year’s 22% to around 23%. This
improvement is primarily due to an
Synopsis across domestic and export markets, ROW North America ROW North America ROW North America enhanced product mix, underpinned
he Indian pharmaceutical indus- with signifi cant contributions from RANJAN SHARMA by the introduction of new products.
try, encompassing both domes- both regulated and semi/unregulated Senior Director USD Bn 16.4 11.4 USD Bn 21.0 14.9 CareEdge Ratings projects that the
Ttic and export, demonstrated a markets. ranjan.sharma@careedge.in USD Bn 10.7 6.5 PBILDT% will further increase by
robust Compounded Annual Growth 38% 41% 41% about 50 to 100 basis points in FY25.
Rate (CAGR) of approximately 8% Indian pharma exhibits healthy growth PULKIT AGARWAL 62% CAGR ~8.5% 59% CAGR ~9% 59% This expected growth is attributed to
from FY18 to FY24. This growth was both domestically and in exports Director several strategic initiatives, including
driven by an 8% increase in exports and The Indian pharmaceutical indus- Pulkit.agarwal@careedge.in entry into complex and specialty seg-
a 7% rise in the domestic market during try has shown a commendable CAGR ments, selective ANDA fi lings, expanded
the same period. of approximately 8% between FY18 D. NAVEEN KUMAR USD 17.3 bn USD 27.9 bn USD 35.9 bn market penetration in the Rest of the
and FY24, with the domestic market Associate Director World (ROW), enhanced productivity
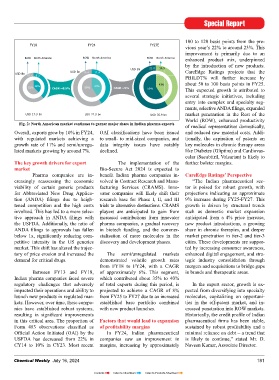
In FY24, the Indian pharmaceuti- expanding by 7% and exports by 8%. Dnaveen.kumar@careedge.in Fig. 2: North American market continues to garner major share in Indian pharma exports of medical representatives domestically,
cal industry expanded by nearly 9% FY24 was particularly strong, with the Overall, exports grew by 10% in FY24, OAI classifi cations have been issued and reduced raw material costs. Addi-
year-over-year, reaching approximately domestic sector growing by 9% and CareEdge Ratings with regulated markets achieving a to small- to mid-sized companies, and tionally, the expiration of patents on
US$54-bn. Exports experienced a exports by 10%. growth rate of 11% and semi/unregu- data integrity issues have notably key molecules in chronic therapy areas
healthy growth rate of 10%, while about 2% to 3% was due to rise in lated markets growing by around 7%. declined. like Diabetes (Gliptins) and Cardiovas-
the domestic market saw a consistent Several factors contributed to the demand for the existing therapies. cular (Sacubitril, Valsartan) is likely to
increase of 9% compared to FY23. domestic market’s 9% growth in FY24. The key growth drivers for export The implementation of the further bolster margins.
There was a notable rise in demand Exports showed robust growth, market Bio-Secure Act 2024 is expected to
Within the export sector, regulated for both acute and chronic segments. especially to the North American market, Pharma companies are in- benefi t Indian pharma companies in- CareEdge Ratings’ Perspective
markets (contributing ~60% of total The revision in prices adopted by the which comprises about 40% of India’s creasingly reassessing the economic volved in Contract Research and Manu- “The Indian pharmaceutical sec-
exports) experienced an 11% y-o-y pharma companies as allowed under total pharmaceutical exports. After wit- viability of certain generic products facturing Services (CRAMS). Inno- tor is poised for robust growth, with
growth, whereas the semi-regulated and the National Pharmaceutical Pricing nessing signifi cant pricing pressures for Abbreviated New Drug Applica- vator companies will likely shift their projections indicating an approximate
unregulated markets registered a 7% Authority (NPPA) to the extent of 4% to post COVID-19 up to FY23, the region tion (ANDA) fi lings due to heigh- research base for Phase I, II, and III 9% increase during FY25-FY27. This
y-o-y growth in FY24. Notably, after a 5% positively impacted overall revenue saw a turnaround with a growth rate of tened competition and the high costs trials to alternative destinations. CRAMS growth is driven by structural trends
contraction of about 3% in FY23 due to growth. The launch of new products approximately 13% in FY24. Contri- involved. This has led to a more selec- players are anticipated to gain from such as domestic market expansion
geopolitical issues, the semi-regulated/ also played a role in driving growth buting factors included the easing tive approach in ANDA fi lings with increased contributions from innovator anticipated from a 4% price increase,
unregulated markets have rebounded by about 2% to 3%. Therapies for of pricing pressures, revitalization of the USFDA. Additionally, the ratio of pharma companies, a gradual recovery new product introductions, a growing
strongly. CareEdge Ratings expects cardiac conditions, diabetes, and central biotech funding, the launch of specialty ANDA fi lings to approvals has fallen in biotech funding, and the commer- share in chronic therapies, and deeper
this segment to continue its upward tra- nervous system (CNS) disorders expe- products, and deeper penetration in the below 1x, signifi cantly reducing com- cialisation of more molecules in the market penetration in tier-2 and tier-3
jectory at a CAGR of about 8% for the rienced over 10% y-o-y growth, with generic market. European, African, and petitive intensity in the US generics discovery and development phases. cities. These developments are suppor-
period FY25-FY27. Meanwhile, ex- other therapeutic areas also showing Asian markets reported growth rates market. This shift has altered the trajec- ted by increasing consumer awareness,
ports to regulated markets are expected strong performance. Apart from above, between 7% and 8.5% during FY24. tory of price erosion and increased the The semi/unregulated markets enhanced digital engagement, and stra-
to grow at a rate of approximately 9% demand for critical drugs. demonstrated volatile growth rates tegic industry consolidation through
during the same forecast period. from FY18 to FY24, with a CAGR mergers and acquisitions to bridge gaps
Between FY13 and FY18, of approximately 6%. This segment, in brands and therapeutic areas.
CareEdge Ratings forecasts an Indian pharma companies faced severe which contributed about 35% to 40%
overall industry growth rate of approxi- regulatory challenges that adversely of total exports during this period, is In the export sector, growth is ex-
mately 9% in the forthcoming years. impacted their operations and ability to projected to achieve a CAGR of 8% pected from diversifying into specialty
This expectation is based on the launch new products in regulated mar- from FY25 to FY27 due to an increased molecules, capitalizing on opportuni-
anticipated parallel growth rates in kets. However, over time, these compa- established base portfolio combined ties in the off-patent market, and in-
both export and domestic markets, each nies have established robust systems, with new product launches. creased penetration into ROW markets.
expected to sustain a growth rate of resulting in signifi cant improvements Historically, the credit profi le of Indian
around 9%. in this critical area. The proportion of Factors that would lead to expansion pharmaceutical fi rms has been stable,
Form 483 observations classifi ed as of profi tability margins sustained by robust profi tability and a
In summary, the Indian pharmaceu- Offi cial Action Initiated (OAI) by the In FY24, Indian pharmaceutical minimal reliance on debt – a trend that
tical industry is poised for continued USFDA has decreased from 22% in companies saw an improvement in is likely to continue,” stated Mr. D.
expansion, driven by balanced growth Fig. 1: Indian pharmaceutical industry to grow by ~9% during FY25-FY27 CY14 to 10% in CY23. Most recent margins, increasing by approximately Naveen Kumar, Associate Director.
180 Chemical Weekly July 16, 2024 Chemical Weekly July 16, 2024 181
Contents Index to Advertisers Index to Products Advertised