
Page 182 - CW E-Magazine (28-1-2025)
P. 182
Special Report
25-28% of its requirement. To boost the present capacity of 31.3-mtpa with leading to higher domestic production.
its domestic production, the govern- most of the urea capacities operating at With the proposed commissioning of
ment notifi ed the New Investment optimum capacity utilisation level. an additional 1.27-mtpa capacity,
Policy 2012 in fi scal 2013. Under this, import dependency is expected to
six plants with a capacity of 1.27-mtpa Dependence on the import of urea further reduce to less than 15% by FY26.
each have been gradually commis- has seen a decline from 25-28% ear-
sioned over the past fi ve fi scals. As a lier to 19-20% in recent years, with High import dependency for DAP
result, the total installed capacity of urea the stabilisation of added capacities in More than half of India’s require-
in India increased by around 30% to the domestic market over FY22-FY24 ment for DAP is met through imports.
DAP contains 46% phosphate and 18%
400 30% nitrogen. Rock phosphate is the key
28% raw material for DAP and other NPK
25%
300 19% 20% fertilisers, and due to the meagre natural
(Lakh MT) 200 20% 14% 15% resources of rock phosphate in India,
we are majorly dependent on imports
100 10% for them as well. Accordingly, import
5% dependency for DAP is expected to
continue going forward.
- 0%
FY22 FY23 FY24 8MFY25
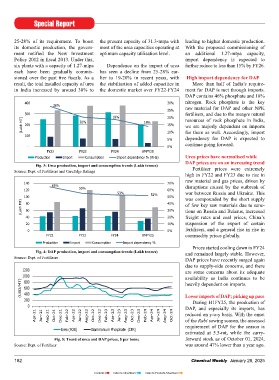
Production Import Consumption Import dependency % (RHS) Urea prices have normalised while
DAP prices are on an increasing trend
Fig. 3: Urea production, import and consumption trends (Lakh tonnes)
Source: Dept. of Fertilisers and CareEdge Ratings Fertiliser prices were extremely
high in FY22 and FY23 due to rise in
raw material and gas prices, driven by
140 70%
65% disruptions caused by the outbreak of
120 55% 60%
53% 52% war between Russia and Ukraine. This
100 50% was compounded by the short supply
(Lakh MT) 80 40% of few key raw materials due to sanc-
tions on Russia and Belarus, increased
30%
60
40 20% freight rates and coal prices, China’s
20 10% suspension of the export of certain
0 0% fertilisers, and a general rise in rise in
FY22 FY23 FY24 8MFY25 commodity prices globally.
Production Import Consumption Import dependency %
Prices started cooling down in FY24
Fig. 4: DAP production, import and consumption trends (Lakh tonnes) and remained largely stable. However,
Source: Dept. of Fertilisers DAP prices have recently surged again
due to supply-side concerns, and there
1200 are some concerns about its adequate
1000 availability as India continues to be
(USD/MT) 600
800 heavily dependent on imports.
400
200 Lower imports of DAP; picking up pace
During H1FY25, the production of
0 DAP, and especially its imports, has
Apr-21 Jun-21 Aug-21 Oct-21 Dec-21 Feb-22 Apr-22 Jun-22 Aug-22 Oct-22 Dec-22 Feb-23 Apr-23 Jun-23 Aug-23 Oct-23 Dec-23 Feb-24 Apr-24 Jun-24 Aug-24 Oct-24 reduced on y-o-y basis. With the onset
of the Rabi sowing season, the assessed
requirement of DAP for the season is
Urea (FOB) Diammonium Phosphate (CFR)
estimated at 5.5-mt, while the carry-
Fig. 5: Trend of urea and DAP prices, $ per tonne forward stock as of October 01, 2024,
Source: Dept. of Fertilizer was around 47% lower than a year ago.
182 Chemical Weekly January 28, 2025
Contents Index to Advertisers Index to Products Advertised