
Page 181 - CW E-Magazine (28-1-2025)
P. 181
Special Report Special Report
by SEM followed by the corresponding the sample has several forms of iron BUSINESS OUTLOOK
EDS patterns from scanned images of sulphides. XRF can provide complete
Pb carbonate (left) and Pb oxide (right) alloy chemistry, including percent by Fertiliser demand to grow 2-3% in FY25;concerns
are shown in Figure 9, and Figure 10, weight of lead in metals. The benefi ts
Fig. 11: Corrosion of PSV Fittings on Instru- respectively. of Raman scattering include the ability persist around availability of DAP
mentation Tubes in an Off-shore Platform in an to detect poorly crystalline phases and
Oil and Gas Industry due to Galvanic corrosion. Root cause analysis of corrosion closely-overlapping patterns present in SYNOPSIS acid, rock phosphate and sulphur. Prices The formula-driven prices for
available for analysing scale on piping mechanism the corrosion products. Raman can also ertiliser consumption is expected of all the key raw materials remained domestic gas have also been rationalised
specimens. After being cut open, sam- Corrosion of pressure safety valve be used to differentiate the various sur- to grow by 2-3% in FY25 due to elevated in the latter part of FY22 and with the softening of imported gas prices.
ples are visually inspected for appea- (PSV) fi ttings on instrumentation tubes face iron oxides, hydroxides and oxy- Fan above-normal monsoon this most of FY23 before rationalising The price of gas from normal fi elds
rance, texture and colour, and then pho- in an off-shore platform in an oil and gas hydroxides, aluminium oxides, copper year, adequate reservoir levels, timely thereafter, thus paving the way for eas- is currently capped at $6.50/mmBtu,
tographed. Based on the photographic industry took place causing failure of carbon corrosion products and zirconium upward revision in Minimum Support ing of fertiliser prices and consequently whereas the price of gas extracted
resolution there are two types of steel PSV fi ttings as shown in Figure 11. oxides on a metal surface. Prices (MSPs) for major Kharif & Rabi the subsidy requirement. However, the from diffi cult fi elds is at $10/mmBtu.
photography – macro and micro (with crops, and increased area under cultivation. prices of ammonia have started increas- In comparison, imported gas prices are
up to 50x magnifi cation). Chemical analysis of the rust par- REFERENCES ing since June 2024. currently hovering at around $12-13/
ticles indicated that the debris is of 1. Schweitzer, P.A., Ed., Marcel Prices of major raw materials for mmBtu, down from the high of $40-50/
Figure 5 shows macro-photograph oxidized carbon steel. Based on the Dekker, (1996), Corrosion Engi- fertilisers have rationalised post the Stabilisation of prices of domestic mmBtu seen in FY23 post-outbreak of
of lead (left) and brass (right). It can be analysis of corrosion product (rust), it neering Handbook. sharp increase witnessed in FY23. Natural gas the Russia-Ukraine war. The rationa-
observed that for lead, irregular manga- was diagnosed that galvanic corrosion 2. Fontana, M.G., and Green, N.D., Natural gas prices have also declined Natural gas forms majority of the lised prices of domestic and imported
nese layers are visible and for brass, of carbon steel PSV fi tting in contact ‘Corrosion Engineering’, (1967), after a sudden spike post-the outbreak input cost for urea production and is an gas are helping the sector in lower pro-
incomplete coverage by copper carbonate with 316 stainless steel tube in marine McGraw Hill Book Company, of the Russia-Ukraine war. While India important input for other fertilisers as duction cost and, in turn, reducing the
scale is visible. The left side of Figure atmosphere took place. New York is gradually moving towards self-suffi - well. Out of total domestic gas produc- subsidy requirement.
6 shows micro-photograph of lead, and 3. Fytianos, G., Ucar, S., Grims, T.A., ciency in its highly consumed fertiliser, tion, more than 50% is consumed by
the right side depicts micro-photograph CONCLUSION Hallvolid, F., Hanna, K., “Corro- viz., urea, import dependency remains the fertiliser sector. Domestic gas is Reduced import dependency for urea
of brass parts. All corrosion reactions produce sion evaluation by SEM-EDS, ICP- high for complex fertilisers. extracted from a mix of both normal Historically, India has been depen-
corrosion products. Analysing them is MS, and XRD”, Energy Procedia, and diffi cult fi elds. dent on urea import to the extent of
Figure 7 shows the XRD pattern one of the most important techniques 86, Elsevier, pp: 197-204, (2016). Diammonium phosphate (DAP) is
from a lead sample. Blank spectrum for determining the mechanism. It need 4. Gardiner, C.P., Melchers, R.E., “Bulk the second-highest consumed fertiliser 5000
using cleaned pipe can be subtracted not be overemphasised that proper Carrier Corrosion Modelling”, Paper in India after urea, with close to half 4000
from this pattern to remove the under- technique(s) should also be selected and presented in the 11th International of India’s consumption requirement 3000
lying noise generated from lead metal applied for analysing the root cause of Off-shore & Polar Engineering met through imports. During H1FY25, (USD/MT) 2000
peaks. The highest peak, in this case the corrosion. Chemical analysis should Conference, Norway, 17th June, 2001. production of DAP, and especially its 1000
leadhillite at 25°, is assigned a value be carried out for the bulk sample of 5. Waseda, Y., and Suziki, S., “Charac- imports, reduced signifi cantly on a y-o-y 0
of 100. Then the highest peak of other corrosion product(s) to check confor- terization of corrosion products on basis, resulting in lower availability of
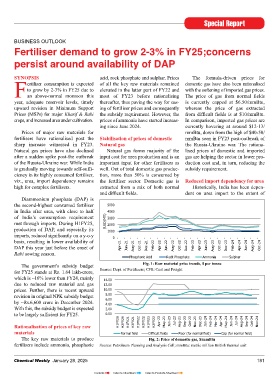
minerals is identifi ed and reported as a mity with specifi cations. Any major devia- steel surfaces”, Advances in Materi- DAP this year just before the onset of Apr-21 Jun-21 Aug-21 Oct-21 Dec-21 Feb-22 Apr-22 Jun-22 Aug-22 Oct-22 Dec-22 Feb-23 Apr-23 Jun-23 Aug-23 Oct-23 Dec-23 Feb-24 Apr-24 Jun-24 Aug-24 Oct-24
percentage of the height of this peak. tion from specifi cation limits should be als Research, Vol. 7, (2006), Springer. Rabi sowing season.
rechecked. Chemical analysis should 6. Stevan Bradley, “Analyzing aque- Phosphoric Acid Rock Phosphate Ammonia Sulphur
Figure 8 shows the Raman spec- also be carried out on surface corrosion ous corrosion products”. Corro- The government’s subsidy budget Fig. 1: Raw material price trends, $ per tonne
trum from pipe scale dominated by products, on deposits, and on coatings. sionpedia, April 27, 2021. for FY25 stands at Rs. 1.64 lakh-crore, Source: Dept. of Fertilizers; CFR: Cost and Freight
lead carbonate. Service conditions and fl uid composi- 7. Flint Water Advisory Tax Force – which is ~16% lower than FY24, mainly 14.00
tion would indicate the elements to look Final Report, March 2016, www. due to reduced raw material and gas 12.00
XRF can provide the complete alloy for in corrosion products: Fe, Cr, Ni, michigan.gov./documents/snyder. prices. Further, there is recent upward 10.00
chemistry, including percent by weight Mo, S, Si, Mn, etc. Techniques such as 8. Powder Diffraction Application revision in original NPK subsidy budget 8.00
of lead in metals. XRF uses 2-3 grams AES, AAS, and XRD are the commonly notes on XRD analysis of scale and by ~Rs.6,600 crore in December 2024. 6.00
4.00
of a combined material (sample plus used. XRD is important as it reveals corrosion products, protoxrd.com/ With this, the subsidy budget is expected 2.00
spectroscopic grade powder). Interfe- the major mineralogy of the scale. More applications/cor. to be largely suffi cient for FY25. 0.00
rence might happen for certain elements recently, EDS has been used to identify 9. Barbara, D.S., and Jerzy, A.S., H1FY20 H2FY20 H1FY21 H2FY21 H1FY22 H2FY22 H1FY23 H2FY23 Apr-23 May-23 Jun-23 Jul-23 Aug-23 Sep-23 Oct-23 Nov-23 Dec-23 Jan-24 Feb-24 Mar-24 Apr-24 May-24 Jun-24 Jul-24 Aug-24 Sep-24 Oct-24 Nov-24
such as barium (Ba) and copper (Cu) corrosion products, but this method also “Analysis of corrosion product Rationalisation of prices of key raw
while other elements have less interfe- has the shortcoming that it only identi- transport using nondestructive materials Normal field Difficult fields Floor (for normal field) Cap (for normal field)
rence(8). Scanned images of Pb carbo- fi es elements, not compounds. Also, XRF & MS techniques”, Atomic The key raw materials to produce Fig. 2: Price of domestic gas, $/mmBtu
nate (left) and Pb oxide (right) obtained its application is almost impossible if Energy of Canada Ltd., (2016). fertilisers include ammonia, phosphoric Source: Petroleum Planning and Analysis Cell; mmBtu: metric million British thermal unit
180 Chemical Weekly January 28, 2025 Chemical Weekly January 28, 2025 181
Contents Index to Advertisers Index to Products Advertised
400 30%
28%
25%
300 20%
(Lakh MT) 200 20% 19% 14% 15%
100 10%
5%
- 0%
FY22 FY23 FY24 8MFY25
Production Import Consumption Import dependency % (RHS)