
Page 179 - CW E-Magazine (28-1-2025)
P. 179
Special Report Special Report
niques, it is able to deal reliably with (Pb) leaching. Lead is a toxic metal
strongly overlapping refl ections. Com- harmful to human health. The introduc-
bining micro-focused XRD with SEM tion of lead into drinking water occurs
can provide both elemental and phase through the corrosion of plumbing pro-
identifi cation of the same location. ducts as water moves through the piping
Such an approach can be quite useful distribution system consisting of lead
for multi-coloured scales and for spatial pipe service lines, lead solder and brass
distribution analyses(3). fi ttings (that contain lead). For example,
in Flint (Michigan, USA) corrosion of
Bulk analysis of corrosion products aging pipes caused extremely elevated
Although an EDS analysis can pro- lead concentration in water and exposed
Fig. 6: Microphotograph of lead (left) and brass (right) parts are shown in the photos.
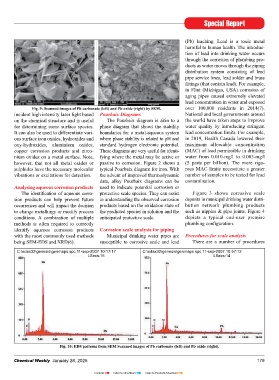
vide local elemental analyses, it is some- Fig. 9: Scanned images of Pb carbonate (left) and Pb oxide (right) by SEM. over 100,000 residents in 2014(7).
times useful to obtain a bulk quantitative incident high intensity laser light based Pourbaix Diagrams National and local governments around
analysis of the scale. Such information on the chemical structure and is useful The Pourbaix diagram is akin to a the world have taken steps to improve
can be used to identify and quantify trace for determining some surface species. phase diagram that shows the stability water quality by introducing stringent
elements or the potential metal source for It can also be used to differentiate vari- boundaries for a metal-aqueous system lead concentration limits. For example,
the deposit if it was no longer adherent ous surface iron oxides, hydroxides and where phase stability is related to pH and in 2019, Health Canada lowered their
to the metal. Potential instrumental tech- oxy-hydroxides, aluminium oxides, standard hydrogen electronic potential. maximum allowable concentration
niques include XRF, inductively coupled copper corrosion products and zirco- These diagrams are very useful for identi- (MAC) of lead permissible in drinking
plasma mass spectroscopy (ICP-MS) and nium oxides on a metal surface. Note, fying where the metal may be active or water from 0.010-mg/l to 0.005-mg/l
atomic adsorption spectroscopy (AAS). however, that not all metal oxides or passive to corrosion. Figure 2 shows a (5 parts per billion). The more rigo-
Additionally, chromatographic instrumen- sulphides have the necessary molecular typical Pourbaix diagram for iron. With rous MAC limits necessitate a greater
tation can be used to detect and quantify vibrations or excitations for detection. the advent of improved thermodynamic number of samples to be tested for lead
ion constituents in corrosion deposits data, alloy Pourbaix diagrams can be contamination.
Fig. 7: Plot of an X-ray diffraction (XRD) pattern from a lead sample.
such as Cl , F, CO , and NH . However, Analysing aqueous corrosion products used to indicate potential corrosion or
-
2-
+
4
3
special sample preparation is required for The identifi cation of aqueous corro- protective scale species. They can assist Figure 3 shows corrosive scale
Hydrocerussite 1049
7000 these techniques(4). sion products can help prevent future in understanding the observed corrosion deposits in municipal drinking water distri-
occurrences and will impact the decision products based on the oxidation state of bution network plumbing products
Cerussite 1052 Surface analysis of corrosion products to change metallurgy or modify process the predicted species in solution and the such as nipples & pipe joints. Figure 4
6000 Surface analysis techniques such as conditions. A combination of multiple anticipated protective scale. depicts a typical end-user premise
Counts Auger Electron Spectroscopy (AES) or methods is often required to correctly plumbing confi guration.
identify aqueous corrosion products Corrosion scale analysis for piping
x-ray photoelectron spectroscopy (XPS)
5000 can provide information on the outer with the most commonly used methods Municipal drinking water pipes are Procedures for scale analysis
atomic layers. In addition, XPS can deter- being SEM-EDS and XRD(6). susceptible to corrosive scale and lead There are a number of procedures
mine the binding energy of elements
4000 present on the surface, which can pro- C:\edax32\genesis\genmaps.spc 11-sep-2007 10:17:17 C:\edax32\genesis\genmaps.spc 11-sep-2007 10:57:12
LSecs:15
LSecs:14
vide information on their chemical state.
1000 1010 1020 1030 1040 1050 1060 1070 1080 1090 1100
Wavenumber cm 1 These techniques are extremely use-
Fig. 8: Raman spectrum from a pipe scale dominated by lead carbonate. ful for analysing thin protective scales,
for the identifi cation of the various during sample preparation, which can multi-layer deposits and sub-surface dif-
compounds in the corrosion scale. cause some planes to produce a greater fusion into the base metal. Depth profi l-
intensity ratio than others and impact the ing is a useful XPS technique, but inter-
XRD is very useful for identifi cation quantization from peak intensity ratios. pretation can be muddled by ion mixing
of compounds present because atomic from the sputtering process(5).
substitution will produce a small lattice Quantifi cation of the various com-
strain that can be diffi cult to detect. For ponents requires a Rietveld refi nement, FTIR and Raman imaging and
example, substitution of Ca ions into which is a technique used in the charac- spectroscopy are often used to identify
+2
FeCO may not be detectable. Because terisation of crystalline materials. organic compounds in corrosion products.
3
the shape of crystals of corrosion pro- This technique was a signifi cant step Both techniques can analyse micro-vol-
ducts/scale tends to be platy, fi brous or forward in the diffraction analysis of umes. Raman is a light scattering tech-
tubular, they may not randomly orient powder samples as, unlike other tech- nique where the molecule scatters the Fig. 10: EDS patterns from SEM Scanned images of Pb carbonate (left) and Pb oxide (right).
178 Chemical Weekly January 28, 2025 Chemical Weekly January 28, 2025 179
Contents Index to Advertisers Index to Products Advertised