
Page 182 - CW E-Magazine (2-1-2024)
P. 182
Special Report Special Report
ash. However, sluggish demand in textiles, Imports have increased by around
a marginal decline in the production of 72% between April 2023 and September
soaps and detergent, and a decline in the 2023 against the corresponding year-
paper industry during H1FY24 as com- ago period due to an increase in imports
pared to the corresponding period a year from Russia, Turkey & USA. The heavy
ago, are expected to negatively impact the increase in imports has further added to
demand for soda ash. the pricing pressure.
Post sharp spike in FY23, moderation Operating margins to moderate in
in prices seen FY24 and FY25
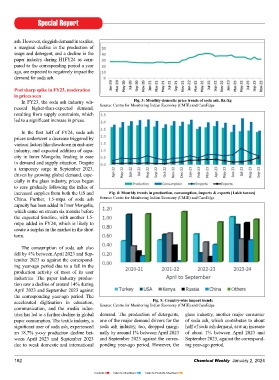
In FY23, the soda ash industry wit- Fig. 3: Monthly domestic price trends of soda ash. Rs./kg With moderation in soda ash realisa-
nessed higher-than-expected demand, Source: Centre for Monitoring Indian Economy (CMIE) and CareEdge tion, the operating margins are expected
resulting from supply constraints, which to correct by 400-550 bps in FY24 and
led to a signifi cant increase in prices. further marginally by around 50-100 bps
in FY24-25 due to soda ash price correc- Fig. 6: EBITDA vs. Cost of Sales, %
In the fi rst half of FY24, soda ash tion, although this will be partially offset Source: Centre for Monitoring Indian Economy (CMIE) and CareEdge
prices underwent a decrease triggered by by a fall in energy prices. Sales volumes expected to lead to a return to the typical With the growing demand from glass
various factors like slowdown in end-user are likely to remain under pressure even margin range of 23-24%. and EV segment, which will lead to
industry, and expected addition of capa- in the subsequent quarters, given the increased demand for soda ash in the
city in Inner Mongolia, leading to ease sluggishness in demand from key user Capex to accelerate for meeting long- long term, various major soda ash manu-
in demand and supply situation. Despite industries. Furthermore, domestic prices term growth in demand facturers in India have announced capex
a temporary surge in September 2023, of soda ash have largely been on a down- The Indian soda ash market is ex- plans, the aggregate of which is as below
driven by growing global demand, espe- ward trajectory since March 2023. pected to grow at a CAGR of 2-3% from (in lakh tonnes per annum):
cially in the glass industry, prices began current annual consumption of 3.5-mt to FY23: 0.6
to ease gradually following the infl ux of On the cost front, the prices of key 3.6-mt in FY23, to reach 3.7-mt to 3.8-mt FY24: 1.85
increased supplies from both the US and Fig. 4: Monthly trends in production, consumption, imports & exports [Lakh tonnes] raw materials like salt, limestone, and over the period FY24 and FY25. FY25: 1.15
China. Further, 1.5-mtpa of soda ash Source: Centre for Monitoring Indian Economy (CMIE) and CareEdge coal are moving upwards, which will FY26: 7.5
capacity has been added in Inner Mongolia, further dent margins. The demand for soda ash mainly
which came on stream six months before arises from industries such as glass, soaps CareEdge Ratings View
the expected timeline, with another 1.5- Soda ash production in India predo- and detergents, textiles, and paper and The Indian soda ash industry is anti-
mtpa added in FY24, which is likely to minantly relies on synthetic methods due to pulp. Almost half of all the soda ash pro- cipated to revert to the FY22 price and
create a surplus in the market in the short the unavailability of natural sources. This duction is consumed by the glass indus- profi tability levels, viewing FY23 as an
term. process involves substantial raw mate- try. Soda ash serves as a vital component anomaly. This expected regression in
rial expenses and necessitates access to in glass manufacturing; when mixed with both, volume and profi tability in FY24,
The consumption of soda ash also signifi cant quantities of salt, limestone, silica – the primary glass ingredient – is due to subdued demand and price cor-
fell by 4% between April 2023 and Sep- and coal/lignite, often requiring owner- soda ash acts as a fl uxing agent, lower- rections compared to FY23. CareEdge
tember 2023 as against the correspond- ship of captive mines for cost-effi ciency. ing the melting point of the mixture. This Ratings expects the industry to record
ing year-ago period due to a fall in the The production of 1-tonne of soda ash reduces energy consumption during the deceleration in the top-line and operat-
production activity of most of its user demands 5-tonnes of raw materials, leading glass production process, contributing to ing margins by 400-550 bps in FY24 and
industries. The paper industry produc- to higher energy and raw material costs. effi ciency. The glass industry, spanning further marginally by around 50-100 bps
tion saw a decline of around 14% during Furthermore, changes in the balance bet- construction, packaging, automotive, and in FY25 due to soda ash price correction,
April 2023 and September 2023 against ween supply and demand, coupled with electronics, heavily relies on soda ash. although this will be partially offset by a
the corresponding year-ago period. The the instability of input prices, conse- fall in energy prices.
Fig. 5: Country-wise import trends
accelerated digitisation in education, Source: Centre for Monitoring Indian Economy (CMIE) and CareEdge quently, impact the profi t margins. India’s total installed capacity for soda
communication, and the media indus- ash is 4.2-mtpa, but the domestic produc- However, the long-term prospects
tries has led to a further decline in global demand. The production of detergents, glass industry, another major consumer The EBITDA margins have histori- tion in FY23 was around 3.2-mt. Currently, look promising, driven by growing
paper consumption. The textile industry, a one of the major demand drivers for the of soda ash, which contributes to about cally averaged between 23-24%. How- on average, around 18% of the demand demand for EVs and solar glass, which
signifi cant user of soda ash, experienced soda ash industry, too, dropped margi- half of soda ash demand, saw an increase ever, in FY23, it experienced a notable is met by imports. Considering the past is anticipated to increase the need for
an 18.7% y-o-y production decline bet- nally by around 1% between April 2023 of about 1% between April 2023 and increase to around 30%, primarily due trends in production, import and export, soda ash. All these factors will enable
ween April 2023 and September 2023 and September 2023 against the corres- September 2023, against the correspond- to the elevated prices of soda ash. Never- and without new capacity additions, this the Indian soda ash industry to grow by
due to weak domestic and international ponding year-ago period. However, the ing year-ago period. theless, the recent price adjustments are dependency can surge to 34% by FY30. a CAGR of 2-3% from FY23 to FY25.
182 Chemical Weekly January 2, 2024 Chemical Weekly January 2, 2024 183
Contents Index to Advertisers Index to Products Advertised