
Page 185 - CW E-Magazine (15-10-2024)
P. 185
Special Report Special Report
Table 3: Y-o-y volume growth Ind-Ra has also observed a signi- Indian API companies are fairly
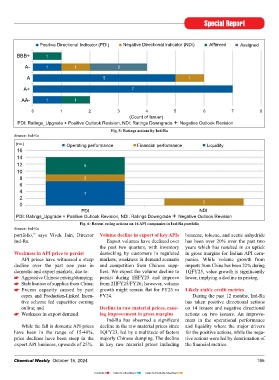
(1QFY25) – key API imports from fi cant increase in the imports of drug diversifi ed at the portfolio level, and Positive Directional Indicator (PDI) Negative Directional Indicator (NDI) Affi rmed Assigned
China intermediates/bulk drugs used for manu- pricing weakness in few molecules has BBB+ 1
API Volume facturing API/formulations from China, been offset by lower raw material costs
growth, % which has accentuated the downward in the past one year. Ind-Ra thus has A- 1 1 2
Cefadroxil 115.6 momentum in realisations. While the observed an improvement in the ross
total volume of imports from China margins for API players. A weakness in
Ciprofl oxacin & 85.0 grew over 20% y-o-y during 1QFY25, revenue growth y-o-y has also been off- A 5 1
salts import volumes of few large molecules set by a gross margin improvement of A+ 7
Paracetamol 81.3 grew over 80% y-o-y. While exports of over 300bp y-o-y and healthy capacity
Penicillin & salts 80.2 APIs to regulated markets are long term utilisation, leading to an improvement AA- 1 1
Amoxycillin & salts 50.7 in nature where the pricing erosion in EBITDA at an aggregate level. 0 1 2 3 4 5 6 7 8
6-APA 29.2 may not be severe, Ind-Ra believes the (Count of Issuer)
Source: Ministry of Commerce and Industry; Chinese competition may lead to a steep “Despite the weakness in API pric- PDI: Ratings_Upgrade + Positive Outlook Revision, NDI: Ratings Downgrade + Negative Outlook Revision
Ind-Ra Analysis erosion in the pricing and profi tabi- ing over the past few quarters, the rev-
prices have declined over 50% y-o-y lity in markets excluding the regulated enue growth was driven by volumes Source: Ind-Ra Fig. 5: Ratings actions by Ind-Ra
in some cases), Ind-Ra opines the pric- ones. API export volumes declined 8% during FY24, which may not sustain
ing challenges will persist, primarily y-o-y during 1QFY25. Ind-Ra expects in FY25. The decline in raw material (no.) Operating performance Financial performance Liquidity
caused by the competition from price stabilisation from 2HFY25/FY26, costs, better cost control and portfolio 16
Chinese players in key large volume led by an improving demand scenario diversifi cation have resulted in stable 14
molecules. post a weaker 1HFY25. credit metrics for Ind-Ra rated pharma 12 5
(%) Realisation (RHS) YoY volume growth (LHS) YoY value growth (LHS) (INR/kg) 10
25 1,200 8 2
22.2 6
20 1,000 4 7
15 11.2 13.2 800 2 2
12.0 0
10 600 PDI NDI
3.5 PDI: Ratings_Upgrade + Positive Outlook Revision, NDI: Ratings Downgrade + Negative Outlook Revision
5 400
-0.4 Fig. 6: Recent rating actions on 16 API companies in Ind-Ra portfolio
0 200 Source: Ind-Ra
960 894 786 portfolio,” says Vivek Jain, Director Volume decline in export of key APIs benzene, toluene, and acetic anhydride
-5 0 Ind-Ra. Export volumes have declined over has been over 20% over the past two
1QFY23 1QFY24 1QFY25 the past two quarters, with inventory years which has resulted in an uptick
Fig. 3: Imports of APIs and drug intermediates from China Weakness in API price to persist destocking by customers in regulated in gross margins for Indian API com-
Source: Ministry of Commerce and Industry; Ind-Ra Analysis API prices have witnessed a steep markets, weakness in demand scenario panies. While volume growth from
decline over the past one year in and competition from Chinese supp- imports from China has been 22% during
46 44 43 44 domestic and export markets, due to: liers. We expect the volume decline to 1QFY25, value growth is signifi cantly
44 Aggressive Chinese pricing/dumping; persist during 1HFY25 and improve lower, implying a decline in pricing.
41 41 41 Stabilisation of supplies from China; from 2HFY25/FY26; however, volume
42
Excess capacity caused by past growth might remain fl at for FY25 vs Likely stable credit metrics
40
38 37 38 capex and Production-Linked Incen- FY24. During the past 12 months, Ind-Ra
38 tive scheme led capacities coming has taken positive directional actions
36 online; and Decline in raw material prices, caus- on 14 issuers and negative directional
Weakness in export demand. ing improvement in gross margins actions on two issuers. An improve-
34 Ind-Ra has observed a signifi cant ment in the operational performance
32 While the fall in domestic API prices decline in the raw material prices since and liquidity where the major drivers
1QFY23 2QFY23 3QFY23 4QFY23 1QFY24 2QFY24 3QFY24 4QFY24 1QFY25 have been in the range of 15-40%, 1QFY23, led by a multitude of factors for the positive actions, while the nega-
price declines have been steep in the majorly Chinese dumping. The decline tive actions were led by deterioration of
Fig. 4: Average gross margin (%) of 5 API manufacturers
Source: Ace Equity; Ind-Ra Analysis export API business, upwards of 25%. in key raw material prices including the fi nancial metrics.
184 Chemical Weekly October 15, 2024 Chemical Weekly October 15, 2024 185
Contents Index to Advertisers Index to Products Advertised