
Page 188 - CW E-Magazine (25-6-2024)
P. 188
Special Report Special Report
Global value is highly concentrated in a few top therapy areas and driven primarily
by biologics 25% launches continue to drive ~80% sales, but still not exceeded
Pre-COVID levels
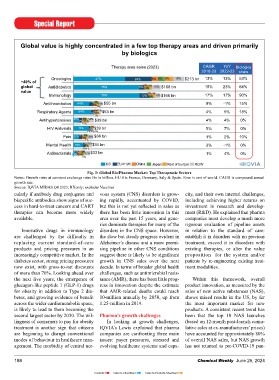
Therapy area sales (2023) CAGR YoY Biologics
2018-23 2022-23 share
Oncologics 47% 24% 6% 6% 8% 10% $213 bn 13% 13% 53%
~40% of
global Antidiabetics 75% 6% 3% 3% 10% $168 bn 15% 23% 64%
2%
value 1% 4% 5.2
Immunology 76% 12% 2% 5% $166 bn 17% 17% 90% 16% 4.6
Antithrombotics 64% 17% 4% 10% $55 bn 9% -1% 15% 4.3 -56% -57% -41%
6%
9% 23%
4% 11%
Respiratory Agents 64% 13% 5% $53 bn 4% 5% 18% 26%
3%
6% 32%
Antihypertensives 25% 17% 11% $39 bn 4% 4% 0% 2.7
10%
3%
HIV Antivirals 76% 13% $39 bn 5% 7% 0% 84% 2.0 2.0 21%
1%1%6% 77% 20%
Pain 27% 17% 5% 29% $38 bn 1% 2% 10% 74% 35%
15%
7% 79%
20%
Mental Health 54% 13% 6% $34 bn 3% -1% 0% 80% 65%
4%4%
13%
Antibacterials 13% 29% 3% 37%$32 bn 1% 4% 0%
5%
US EU4+UK China Japan Rest of Europe ROW
Fig. 3: Global Bio/Pharma Market: Top Therapeutic Sectors
Notes: Growth rates at constant exchange rates Bn in billion. EU 4 is France, Germany, Italy & Spain. Row is rest of world. CAGR is compound annual
growth rate.
Fig. 4: Trend Analysis: New Activa Substances (NAS)
Source: IQVIA MIDAS Q4 2023; RXonly; excludes Vaccines *Top 10 NAS launches ranked by 12 months post-launch cumlative sales
cularly if antibody drug conjugates and vous system (CNS) disorders is grow- city, and their own internal challenges, Source: IQVIA MIDAS Q4 2023, Rx only
bispecifi c antibodies show signs of suc- ing rapidly, accentuated by COVID, including achieving higher returns on
cess in hard-to-treat cancers and CART but this is not yet refl ected in sales as investment in research and develop-
therapies can become more widely there has been little innovation in this ment (R&D). He explained that pharma
available. area over the past 15 years, and gene- companies must develop a much more
rics dominate therapies for many of the rigorous evaluation of pipeline assets
Innovative drugs in immunology disorders in the CNS space. However, in relation to the standard of care:
are challenged by the diffi culty in the slow but steady progress evident in establish it in disorders with no previous
replacing current standard-of-care Alzheimer’s disease and a more promi- treatment, exceed it in disorders with 289 307 100
products and pricing pressures in an sing pipeline in other CNS conditions existing therapies, or alter the value 262 266 281 26% 29%
increasingly competitive market. In the suggest there is likely to be signifi cant proposition for the system and/or 247 23% 23% 24% 25%
diabetes sector, strong pricing pressures growth in CNS sales over the next patients by re-engineering existing treat- 22% 8% 8% 9% 9% 10%
4%
7%
now exist, with gross-to-net discounts decade. In terms of broader global health ment modalities. 7% 19% 18% 18% 17% 16% 12%
of more than 70%. Looking ahead over challenges, such as antimicrobial resis- 17%
the next fi ve years, the emergence of tance (AMR), there has been little prog- Within this framework, overall 20% 20% 20% 20% 21% 22% 17%
glucagon-like peptide 1 (GLP-1) drugs ress in innovation despite the estimate product innovation, as measured by the
for obesity in addition to Type 2 dia- that AMR-related deaths could reach sales of new active substances (NAS), 33% 31% 31% 30% 28% 27% 28%
betes, and growing evidence of benefi t 10-million annually by 2050, up from shows mixed results in the US, by far
across the wider cardiometabolic space, 1.25-million in 2019. the most important market for new
is likely to lead to them becoming the products. A consistent recent trend has
second largest sector by 2030. The wil- Pharma’s growth challenges been that the top 10 NAS launches
lingness of consumers to pay for obesity In looking at growth challenges, (based on 12-month post-launch cumu-
treatment is another sign that citizens IQVIA’s Lewis explained that pharma lative sales at ex-manufacturers’ prices) Fig. 5: Small-Molecule Generics Market
are beginning to disrupt conventional companies are confronting three main have accounted for approximately 80% Notes: Generics include unbanded and branded generics, Rx only, biosimilars are excluded;
Argentina and Turkey excluded due to Fx fl uctuations Bn is billion. LATAM in Latin America. Row is rest of world. EU4 in France, Germany, Italy & Spain.
modes of behaviour in healthcare man- issues: payer pressures, stressed and of overall NAS sales, but NAS growth CAGR is compound annual growth rate.
agement. The morbidity of central ner- evolving healthcare systems and capa- has not returned to pre-COVID-19 pan- Source: IQVIA MIDAS Q4 2023
188 Chemical Weekly June 25, 2024 Chemical Weekly June 25, 2024 189
Contents Index to Advertisers Index to Products Advertised