
Page 186 - CW E-Magazine (25-6-2024)
P. 186
Special Report Special Report
Global pharma industry outlook: The ups and spending and volume growth will con- times faster. In 2023, small-molecules value is highly concentrated in a few
tinue to show diverging regional trends. drugs accounted for $785-billion (58% top therapy areas and driven primarily
downs & projections near term Spending growth through 2028 is of the market) and biologics $559-bil- by biologics,” said IQVIA’s Lewis. On-
expected to be high in North America and lion (42% of the market) compared cology was the largest market segment,
lobal bio/pharma sales growth referred to throughout the article, have PATRICIA VAN ARNUM Western Europe, driven by a wider use to a 69% share for small-molecules valued at $213-billion globally in 2023,
was strong on a value basis been performed at ex-manufacturers’ of novel drugs at higher average prices. and a 31% market share for biologics followed by anti-diabetics at $168-bil-
Gat ex-manufacturers’ prices in prices based on the IQVIA MIDAS Editorial Director, DCAT Above-average volume and spending in 2018 (see Figure 2). Within small lion, and immunology at $166-billion
2023 although volume growth was rela- database. Germany, Italy, and Spain) and the growth through 2028 is expected for molecules, specialty small-molecule (see Figure 3). Combined, these three
tively fl at. What are the growth pros- UK collectively represented 15% of India and Asia-Pacifi c (excluding drugs are growing more than twice as sectors represented approximately 40%
pects in leading geographic markets, Global and regional growth trends the global pharma market, with value Japan), but below-average volume and fast as those of traditional small-mole- of the global market on a value basis.
therapeutic sectors, and in the mix bet- Last year (2023) was a mixed story growth of 9% in 2022-2023, but vol- spending growth is projected for Japan cule drugs (see Figure 2). However,
ween small molecules and biologics? for the global bio/pharma industry. On ume growth of only 1%. Japan, which through 2028. A mixed story is pro- traditional small-molecule drugs still While these three areas – oncology,
a value basis, the global prescription- represented 4% of the global market, jected for China, which will see below- dominate the small-molecule sector, diabetes, and immunology – are the top
Charting industry growth based market increased 10% in 2022- saw value growth of 3% in 2022-2023, average spending growth through 2023, accounting for 71% of small-molecule therapy areas, there are cost, price, and
How did the global bio/pharma 2023, but volume growth was only 2%. but only 1% in volume growth. China, but expanded access to novel drugs drugs in 2023 (see Figure 2). Specialty innovation challenges in each sector,
market perform in 2023, and what can Overall, the global bio/pharmaceutical the third largest geographic market will drive spending growth faster than medicines, as defi ned by the IQVIA, explained Lewis. Overall, oncology
be expected in 2024 and over the next market was valued at $1.3-trillion in behind the US and the EU4 and UK, with volume. are those medicines that treat specifi c, drugs represent approximately 35% of
several years? 2023, with the US representing 52% of an 8% market share in 2023, improved complex diseases with four or more all pipeline assets, but market opportu-
the global market on a value basis. The both on a value and volume growth Small molecules versus biologics of the following attributes: initiated nities are increasingly fragmented due
Graham Lewis, Vice President of US market experienced value growth of basis. Value growth in China improved In looking at market share and only by a specialist; administered by a to the rapid expansion of targeted thera-
Global Pharma Strategy, IQVIA, pro 13% in 2022-2023, but volume growth to 4% in 2022-2023 compared to nega- growth rates on a modality basis, practitioner; requires special handling; pies. “Me-too” therapies are fi nding it
vided an analysis of current and projected of only 2%, down from the 3% seen in tive growth (decline) of 2% in 2021- small-molecules drugs versus biolo unique distribution; high cost; warrants increasingly diffi cult to challenge the
industry performance at the Pharma 2021-2022 (see Figure 1). 2022, and volume growth in 2022-2023 gics, a “changing of the guards” is taking intensive patient care; or requires reim- standards of care. Payers are scrutiniz-
Industry Outlook education program at was 4%, commensurate with its value place, noted IQVIA’s Lewis. Although bursement assistance. ing cost-effectiveness more intensely
DCAT Week, held on March 18, 2024. The value/volume growth differen- growth (see Figure 1). small-molecules still account for the than had previously been the case.
Note: The analyses of market value size tial occurred in other developed mar- largest market share in 2023 globally, Therapeutic sector growth trends However, oncology is and will remain
and/or market value growth, which are kets as well. In 2023, the EU4 (France, Looking ahead through 2028, biologics are growing more than three On a therapeutic sector basis, “global the largest therapy area by 2030, parti-
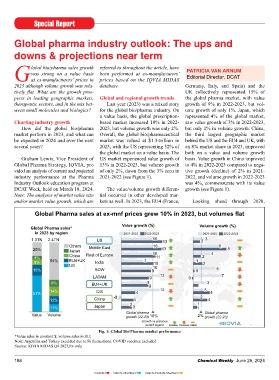
Global Pharma sales at ex-mnf prices grew 10% in 2023, but volumes fl at Global Pharma market growth expected to continue, with biologics and specialty
segments continuing to lead the way
Value growth (%) Volume growth (%)
Global Pharma sales*
in 2023 by region 2021-2022 2022-2023 2021-2022 2022-2023 Global Pharma Market Forecast 1* ‘‘Change of guards” 2**
1.3TN 2.4TN US 10 13 2 3 $Tn Biologics and Small Molecules Small Molecules by Type
Others Middle East 10 6 $Bn, (%) $Bn, (%)
20% Japan 10 13 4 8 +7% 2.3
4% China Rest of Europe 11 2 Small molecules Biologics Traditional Specialty
785
8% 54% EU4+UK India 7 10 1 2 1,344
US +6% 1.6 637
785
15% ROW 9 10 0 6 929 (58%) 558
LATAM 9 12 0 7 1.2 637 4% 478 3% (71%)
9% EU4+UK 8 9 3 (69%) 559 (75%) 7%
228
14% CIS 12 3 291 14% (42%) 159 (29%)
52% 4 4 (31%) (25%)
12% China -2 4 2 4 2018 2023 2018 2023
11% Japan 2 3 1 1 Biologics grow >3x as fast as Specialty small molecules
Global pharma Global pharma 2018 2023 2028 grow >2x as fast as traditional
Value Volume 10% 2% small molecules
growth (22-23) growth (22-23) small molecules
Growth vs previous
period legend Increase Decrease Stable
Fig. 1: Global Bio/Pharma market performance Fig. 2: Global Bio/Pharma Market: Biologics & Small Molecules
*Value sales in constant $; volume sales in SU; *Includes COVID vaccines, OTC and Chinese medicines;
Note: Argentina and Turkey exculded due to Fs fl uctuations. COVID vaccines excluded **Argentina and Turkey exculded due to Fs fl uctuations. COVID vaccines excluded TN is trillion
Source: IQVIA MIDAS Q4 2023,Rx only Source: (1) IQVIA Institute, Global Use of Medicines 2024: Outlook to 2028; (2) IQVIA MIDAS Q4 2023
186 Chemical Weekly June 25, 2024 Chemical Weekly June 25, 2024 187
Contents Index to Advertisers Index to Products Advertised