Page 190 - CW E-Magazine (23-7-2024)
P. 190

Special Report                                                                                                                                                                   Special Report


                                                                                                                     FY25 profi tability to remain weak
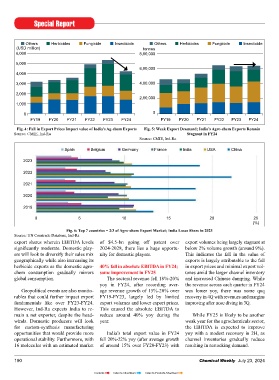
           Others    Herbicides   Fungicide   Insecticide     Others    Herbicides   Fungicide   Insecticide                                            (INR billion)      EBITDA (LHS)        Revenue growht (RHS)
        (USD million)                                     tonnes                                                     with some improvement; credit
       6,000                                            8,00,000                                                     metrics comfortable                200                                                          (%)
                                                                                                                        At  the  sectoral  level,  Ind-Ra  ex-                                                       40
       5,000                                                                                                         pects the revenue to grow yoy in FY25,   150                                                    30
                                                        6,00,000                                                                                                                                                     20
       4,000                                                                                                         due to the lower FY24 base with the   100                                                       10
                                                                                                                     sector revenue declining around 18%
       3,000                                            4,00,000                                                     yoy  in  FY24  (FY23:  up  12%  yoy;   50                                                       0
                                                                                                                     FY22: up 22% yoy) due to the weak                                                               -10
       2,000                                                                                                         pricing and export fundamentals. Fur-                                                           -20
                                                        2,00,000                                                                                         0                                                           -30
       1,000                                                                                                         thermore, EBITDA margins corrected      FY  18  FY19    FY20     FY21    FY22    FY23    FY24
                                                                                                                     to around 12% in FY24 (FY23: 16.2%;
                                                                                                                                                                     Fig. 7: Fall in FY24 EBITDA Levels; Revenue Decline
           0                                                  0                                                      FY22:  16.5%),  resulting  in  ROCE   Source: Company fi nancials, Ind-Ra
             FY19   FY20    FY21   FY22   FY23   FY24            FY19   FY20   FY21   FY22   FY23   FY24             levels plummeting at a sectoral level
                                                                                                                     to  around  8.5%  (FY23:  19%;  FY22:                 Interest Cover (LHS)  Net leverage (RHS)
        Fig. 4: Fall in Export Prices Impact value of India’s Ag-chem Exports  Fig. 5: Weak Export Deamand; India’s Agro-chem Exports Remain            (X)                                                          (X)
       Source: CMIE, Ind-Ra                                                Stagnant in FY24                          21.7%).                            50
                                                        Source: CMIE, Ind-Ra                                                                                                                                         3.0
                                                                                                                        The  EBITDA  margins  and  ROCE   40                                                         2.5
                           Spain     Belgium     Germany      France     India     USA       China                   are expected to improve at a sectoral                                                           2.0
                                                                                                                     level in FY25, led by the higher domes-  30
          2023                                                                                                       tic demand yoy, restocking demand in   20                                                       1.5
                                                                                                                     2HFY25 supporting some exports and                                                              1.0
          2022                                                                                                                                          10
                                                                                                                     some improvement in pricing yoy. Fur-                                                           0.5
                                                                                                                     thermore, sector participants are focus-  0
          2021                                                                                                                                                                                                       0.0
                                                                                                                     ing on improving on their operational    FY20        FY21       FY22        FY23       FY24
                                                                                                                     effi ciencies and furthering cost optimi-  Fig. 8: Credit Metrics Weaken in FY24; However, Balance Sheets Still Comfortable
          2020
                                                                                                                     sation  to support margins amid the   Source: Company fi nancials, Ind-Ra
          2019                                                                                                       industry headwinds. However, margins   (INR billion)                       Capex Intensity (RHS)
                                                                                                                     are unlikely to reach the levels as wit-               Capex (LHS)                               (%)
               0                5                10                15               20               25              nessed over FY22-FY23 with recovery   40                                                         6
                                                                                                     (%)             expected  only  towards  the  fag  end  of                                                       5
                           Fig. 6: Top 7 countries = 2/3 of Agro-chem Export Market; India Loses Share in 2023       FY25.                              30                                                            4
       Source: UN Comtrade Database, Ind-Ra                                                                                                             20                                                            3
       export  shares  wherein  EBITDA  levels  of  $4.5-bn  going  off  patent  over  export volumes being largely stagnant at   However,  despite  the  industry                                                    2
       signifi cantly moderate. Domestic play-  2024-2028, there lies a huge opportu-  below 2% volume growth (around 9%).   headwinds, the balance sheets remain   10                                                 1
       ers will look to diversify their sales mix  nity for domestic players.  This indicates the fall in the value of   strong with comfortable credit metrics,
       geographically while also increasing its                           exports is largely attributable to the fall   led by the strong operational cash fl ow   0  FY20  FY21      FY22        FY23       FY24      0
       herbicide exports as the domestic agro-  40% fall in absolute EBITDA in FY24;   in export prices and minimal export vol-  generation  over  FY21  and  FY22  and
                                                                                                                                                                Fig. 9: Fall in Sectoral Capex in FY24; Sectoral Capex Intensity Low
       chem consumption gradually mirrors  some improvement in FY25       umes amid the larger channel inventory     low  capex  intensity.  The  net  lever-  Source: Company fi nancials, Ind-Ra
       global consumption.                 The sectoral revenue fell 18%-20%  and increased Chinese dumping. While   age increased to 2.4x in FY24 (FY23:
                                         yoy  in  FY24,  after  recording  aver-  the revenue across each quarter in FY24   1.1x;  FY22:  1.2x)  and  gross  interest  caused sector participants to defer  in minimal capital investments and lower
          Geopolitical events are also monito-  age revenue growth of 15%-20% over  was  lower  yoy,  there  was  some  qoq   coverage reduced to around 22x (34x;  their  capex  plans.  Accordingly,  the  R&D  spends.  Domestic  participants
       rables that could further impact export  FY19-FY23,  largely  led  by  limited  recovery in 4Q with revenues and margins   40x), due to the yoy lower operational  capex intensity (capex/operating reve-  will continue to limit its growth capex
       fundamentals  like  over  FY23-FY24.  export volumes and lower export prices.  improving after nose diving in 3Q.  EBITDA.  The  credit  metrics  at  a  nue)  fell  to  2.1%  in  FY24  (FY23:  until the sector fundamentals improve
       However,  Ind-Ra  expects  India  to  re-  This  caused  the  absolute  EBITDA  to                            sectoral level are expected to improve  3.6%; FY22: 4.2%). The capex inten-  and margins see an improvement. Till
       main a net exporter, despite the head-  reduce  around  40%  yoy  during  the   While FY25 is likely to be another   yoy due to an improvement in the  sity  within  the  sector  has  traditionally  then, maintenance capex would be the
       winds.  Domestic  producers  will  look  year.                     weak year for the agrochemicals sector,    operational EBITDA.               been  lower  than  commodity  and  key focus. Ind-Ra expects sector parti-
       for custom-synthesis manufacturing                                 the  EBITDA  is  expected  to  improve                                       specialty chemicals due to factors  cipants to increase its focus on capex
       opportunities that would provide more   India’s  total  export  value  in  FY24  yoy with a modest recovery in 2H, as   FY24 capex lower yoy; lower capex   including domestic consumption con-  to improve sustainability and cost
       operational stability. Furthermore, with  fell 20%-22% yoy (after average growth  channel inventories gradually reduce   intensity              centrated  among  fewer  pesticides,  effi ciency  to  ensure  compliance  with
       16 molecules with an estimated market  of  around  15%  over  FY20-FY23)  with  resulting in restocking demand.  The fall in operating margins has  focus on off-patent products resulting  ESG standards.


       190                                                                      Chemical Weekly  July 23, 2024       Chemical Weekly  July 23, 2024                                                                  191


                                      Contents    Index to Advertisers    Index to Products Advertised
   185   186   187   188   189   190   191   192   193   194   195