Latest Chemical Industry


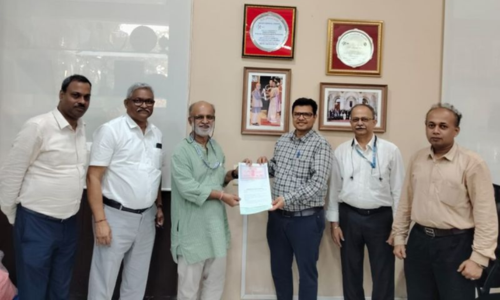
SNF Flopam India bags ONGC project for full field polymer injection at Bechraji field in Gujarat

 3 April, 2026 15:08:07 IST
Agilent inaugurates new customer experience centre in Mumbai
Agilent Technologies, a leading provider of analytical and clinical laboratory technologies headquartered in the US, has opened a...

3 April, 2026 15:05:02 IST
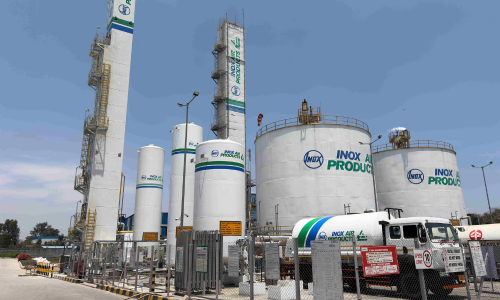
INOX Air Products commissions ultra-high purity liquid oxygen facility in Tamil Nadu
INOX Air Products Pvt. Ltd. (INOXAP), a leading manufacturer of industrial, electronic and medical gases, said it has...
3 April, 2026 15:03:41 IST
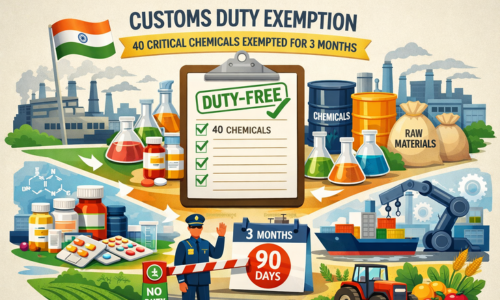
Government exempts 40 critical chemicals from customs duty for three months
The central government has waived customs duty on a wide range of critical chemicals and solvents till June...
3 April, 2026 15:02:12 IST
TotalEnergies and Masdar to merge renewable energy activities in Asia
French energy giant, TotalEnergies, and Abu Dhabi Future Energy Company PJSC – Masdar, a clean energy leader, have...
3 April, 2026 15:01:06 IST
NJ Bio and Ajinomoto Bio‑Pharma announce ADC focussed partnership
NJ Bio, a US-based provider of integrated drug discovery and development services and Ajinomoto Bio‑Pharma Services (Aji Bio‑Pharma),...
3 April, 2026 15:00:07 IST
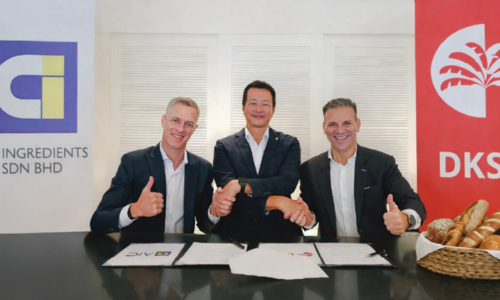
DKSH acquires Malaysian food ingredients firm
Switzerland-based DKSH has announced the acquisition of AIC Ingredients Sdn Bhd, a Malaysia-based functional food ingredients business with...
3 April, 2026 14:59:15 IST
ADNOC and OMV subsidiaries finalise process to create chemicals giant, Borouge International
Abu Dhabi’s XRG, the global energy investment arm of ADNOC, and Austrian energy company OMV have finalised the...

31 March, 2026 17:25:20 IST
Helium supplies take a hit, but carryover may help tide over shortages for now
The ongoing war in the Middle East has shaken up energy, fertiliser and...

31 March, 2026 17:22:35 IST
Evonik adds analytics capabilities at Thane research hub
The Indian arm of German speciality chemicals major Evonik, has inaugurated a new Research, Development & Innovation (RDI)...
31 March, 2026 17:21:48 IST
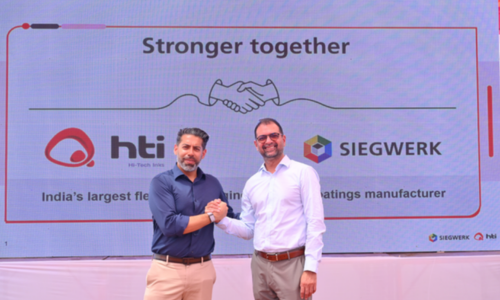
Siegwerk to bolster packaging inks presence with acquisition of Hi-Tech Inks
Siegwerk, a Germany based firm specialising in printing inks and coatings for packaging and labelling, has agreed to...
31 March, 2026 17:20:24 IST
Amar Equipment to co-develop SC carbon dioxide dyeing technology with ICT
Amar Equipment Pvt. Ltd. (AEPL), a leading supplier of process technology solutions and equipment, has signed a Memorandum...
31 March, 2026 17:16:38 IST
QCO on linear alkyl benzene suspended temporarily
The Ministry of Chemicals & Fertilizers has issued a notification on March 30, temporarily suspending the quality control...
PRINT EDITION

Apr 7, 2026
View Digital Issue
Download Issue
View Past Issues
Search For
Exhibitions & Conferences


Watch


OTHER PUBLICATIONS

DATABASES