
Page 197 - CW E-Magazine (10-10-2023)
P. 197
Special Report Special Report
Can India seize emerging FDI & trade opportunities ridor (DMIC) project was proposed. It 16.8 18.8 17.8 15.7 15.0 17.3 17.6
was expected to transform India’s land-
with Japan? scape forever. The project envisaged 9.9 13.1 11.2 12.4 10.5 10.0 14.1 13.6 10.5 12.6 12.7
creation of seven investment zones
9.8
9.6
he potential between India and Japan also tops in environment-related Y.H. GHARPURE across six States with detailed Master 6.7 4.8 8.3 5.6 6.4 7.3 5.8 4.5 4.5 4.8 4.8
Japan for doing business are im- patent applications and publications. Chairman & Managing Director Planning to boost India’s manufactur- 3.2 3.8
Tmense for several reasons. As a business platform, Japan plays Gharpure Consulting Engineers ing sector with the objective of making
an important role as a “bridge nation” Pvt. Ltd. it grow at 14-15% per annum. It also 2009 2010 2011 2012 2013 2014 2015 2016 2017 2018 2019
Japan is an innovation hub. The connecting Asia to the world, thereby E-mail: gharpure03@gmail.com included creating eight smart cities, two -3.5 -3.5 -5.6 -5.9 -3.2 -4.2 -5.2 -6.0 -6.0
country boasts a large number of leading contributing to Asia’s growth. It can do international airports, fi ve power pro- -7.8 -7.9
global companies and SMEs with pro- so for India. Japan also promises a new comparable to the economies of many jects, two mass rapid logistic hubs, etc. Exports Imports Total trade Trade balance
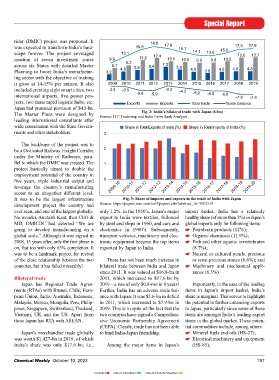
prietary technologies. Japanese fi rms management culture. countries. Sectors with large collabora- Japan had promised provision of $4.5-bn. Fig. 2: India’s bilateral trade with Japan ($-bn)
rank high in the number of international tion potential between India and Japan The Master Plans were designed by Source: ITC Trademap and India Exim Bank Analysis
patent applications (PCT applications) Japan is the world’s third larg- include auto components, engineering, leading international consultants after
thanks to employing the largest num- est economy, and the economic size and electronics, amongst others. wide consultation with the State Govern- Share in Total Exports of India (%) Share in Total Imports of India (%)
ber of researchers per 10,000 people. of each region within the country is ments and other stakeholders. 3
Table 1: India and Japan – a good match Japanese FDI in India The backbone of the project was to
Japan India Japanese FDI in India was only be a Dedicated Railway Freight Corridor 2
Japan has technology India wants technology $1.4-bn in 2017. There are only 1,500 under the Ministry of Railways, para-
Japanese companies operating in India,
Japan has huge reserves (Yen Credit) India wants investment as against 5,900 operating in Thailand! llel to which the DMIC was created. The 1
Japan has stagnating market India has large emerging market, with high project basically aimed to double the
growth potential Exceptions are well established Japa- employment potential of the country in
Japanese population is ageing India has the youngest population globally, and nese companies in India like Maruti fi ve years, triple industrial output and 0
this will continue for next decade Udyog and Honda. They are planning leverage the country’s manufacturing 2009-10 2010-11 2011-12 2012-13 2013-14 2014-15 2015-16 2016-17 2017-18 2018-19 2019-20
investments of around $500-mn per sector to an altogether different level.
60 annum over next 10 years. But their It was to be the largest infrastructure Fig. 3: Share of imports and exports in the trade of India with Japan
50 total investments since 1991 represents development project the country had Source: https://papers.ssrn.com/sol3/papers.cfm?abstract_id=3603315
ever seen, and one of the largest globally. only 1.2%. In the 1950’s, Japan’s major import basket, India has a relatively
40 less than that in China in a single year. No wonder, Amitabh Kant, then CEO & export to India were textiles, followed healthy share (of more than 3%) in Japan’s
Only 4% of the 4,100 or so Japanese
30 companies worldwide have come to MD, DMICDC had asserted “We are by steel and ships in 1960, and cars and global imports only for following items:
20 India. The assumption that Japanese going to develop manufacturing on a electronics in 1980’s. Subsequently, Petroleum products (12%);
Organic chemicals (11.9%);
global scale.” Although it was signed in transport vehicles, machinery and elec-
10 companies are lining up is a delusion. 2008, 15 years after, only the fi rst phase is tronic equipment became the top items Fish and other aquatic invertebrates
Japanese have, as yet, no Yen for India!
0 on, that too with only 63% completion. It exported by Japan to India. (8.7%);
Japan U.S Korea Canada Germany France Russia U.K Italy China DMIC was to transform India’s was to be a landmark project for revival There has not been much increase in Natural or cultured pearls, precious
of the close relationship between the two
or semi-precious stones (8.6%); and
landscape
Fig. 1: Number of researchers per 10,000 people To exploit the potential, in 2008, the countries, but it has failed miserably! bilateral trade between India and Japan Machinery and mechanical appli-
Source: Japan’s Ministry of Internal Affairs and Communications. $100-bn Delhi Mumbai Industrial Cor- Bilateral trade since 2011. It was valued at $16.8-bn in ances (6.3%).
2011, which increased to $17.6-bn by
Table 2: Japan and India – so close but so far Japan has Regional Trade Agree- 2019 – a rise of only $0.8-mn in 8 years! Importantly, in the case of the leading
Japan India Japan multiple ments (RTAs) with Brunei, Chile, Euro- Further, India has an adverse trade bal- items in Japan’s import basket, India’s
Annual GDP [2020] $5,040,108-mn Annual GDP [2021] $3,041,985-mn 1.66 pean Union, India, Australia, Indonesia, ance with Japan. It was $5.6-bn in defi cit share is marginal. This serves to highlight
GDP per capita [2020] $40,053 GDP per capita [2021] $2,204 18.17 Malaysia, Mexico, Mongolia, Peru, Philip- in 2011, which increased to $7.9-bn in the potential to further enhancing exports
Trade balance, % GDP [2020] 0.14% Trade balance, % GDP [2020] -3.58% pines, Singapore, Switzerland, Thailand, 2019. This is in spite of the fact that the to Japan, particularly since some of these
Population [2020] 125,836,021 Population [2020] 1,380,004,385 0.09 Vietnam, UK and the US. Apart from two countries have signed a Comprehen- items are amongst India’s leading export
sive Economic Partnership Agreement items in the global market. These poten-
these Japan has RTA with ASEAN.
Life expectancy [2019] 84.36 years Life expectancy [2019] 69.66 1.2 (CEPA). Clearly, trade has not been able tial commodities include, among others:
Energy consumption [2019] 903,699-GW Energy consumption [2019] 1,229,388 8.09 Japan’s merchandise trade globally to bind India-Japan friendship. Mineral fuels and oils (HS-27);
[7.2-MW/capita] 0.89 MW/capita was worth $1,427-bn in 2019, of which Electrical machinery and equipment
Trade balance [2020] $6,862.3-mn Trade balance [2020] -$95,692.7-mn India’s share was only $17.6-bn, i.e., Among the major items in Japan’s (HS-85);
196 Chemical Weekly October 10, 2023 Chemical Weekly October 10, 2023 197
Contents Index to Advertisers Index to Products Advertised