
Page 162 - CW E-Magazine (6-2-2024)
P. 162
Special Report
Global petrochemicals market in a decade of
unprecedented oversupply
he global petrochemicals mar- will be more than 6% lower than pre- JAMES WILSON
ket is currently in a diffi cult pandemic projections. This has caused Senior Petrochemical Analyst
Tmoment with oversupply driving reduced operating rates and margins in ICIS
utilisation rates and margins for chemi- all regions, even for those feedstock-
cals producers hitting record lows. advantaged producers in the US and declines since 2021, dropping by
Middle East who have seen their cost almost 30%.
The fact that the industry is in a of production advantages increase.
downcycle is no surprise: the scale of Iranian export volumes have almost
the current capacity build out has been Impact of China slowdown halved in 2023 compared to 2020.
clear for years. China – the world’s largest importer Perhaps more surprisingly, total exports
of chemicals – has been responsible for from Saudi Arabia are also down by
What is unique about the situa- around 75% of olefi n and aromatics more than 20%.
tion today is that impacts of capacity capacity additions between 2020-2024.
expansions have been compounded by Combined with a weak economy, this Polyethylene (PE) exports have
weaker than expected demand growth, has resulted in imports of ethylene decreased by a little over 30% and
and there is another wave of capacity derivatives to China decreasing by around ethylene glycol exports are down by
additions due online within the next 20% in the fi rst nine months of 2023, nearly 15%. Overall, Saudi ethylene
fi ve years. compared to the same period in 2020. derivative exports into China are down
by around one-quarter. In marked con-
Chemicals demand proved to be The biggest impact, in both rela- trast, US exports have signifi cantly
surprisingly robust in the immediate tive and absolute terms, has fallen on increased over this period. North
wake of the coronavirus pandemic, other Asian producers. Asia cracking American export volumes to China
however since then demand growth margins have been negative since late have more than doubled in the fi rst
has fallen signifi cantly short of pre- 2021, with a record number of plants nine months of 2023, compared to the
pandemic expectations. Soaring energy being idled for extended periods. Asia same period in 2020.
prices and infl ation, caused by the exports into China have dropped by
Russia-Ukraine war, have acted to more than one-third. While the Middle East has seen
further hamper demand. exports of crude, naphtha and lique-
Notably, Middle Eastern exports fi ed petroleum gas (LPG) increase,
Global ethylene demand in 2024 into China have also shown steady this has not offset the loss of market
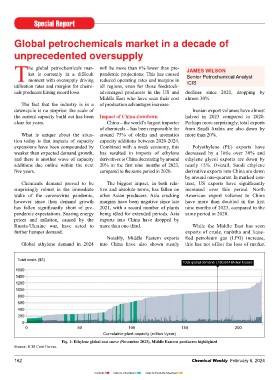
Total costs ($/t)
Total global demand (180,634 Million t/year)
1600
1400
1200
1000
800
600
400
200
0
0 50 100 150 200
Cumulative plant capacity (million t/year)
Fig. 1: Ethylene global cost curve (November 2023), Middle Eastern producers highlighted
Source: ICIS Cost Curves.
162 Chemical Weekly February 6, 2024
Contents Index to Advertisers Index to Products Advertised