
Page 175 - CW E-Magazine (27-8-2024)
P. 175
Special Report
Global markets for agrochemicals and exports
from India
Global market trends of non-crop pesticides are expected 5% of this total and so are still a rela-
he global chemical-based crop to have risen for a second consecu- tively niche segment of the market(2).
protection market is expected to tive year, but far more modestly than
Thave recorded 6.2% growth in in 2021. Revenues from the sector are The crop protection market in 2023
2022 to $69,256-mn at the ex-manufac- expected to have been $8,937-mn – an was relatively fl at in terms of value
turer level (excluding the impact of re- increase of 3.1%. development, with the impacts of lower
tail and distributor margins), according agrochemical prices and unfavourable
to S&P Global Commodity Insights’ Herbicides dominate (~47%) the weather conditions in certain regions
Crop Science team (formerly known as crop sector, followed by fungicides and holding back growth. However, this
Phillips McDougall)(1). insecticides (both approximately ~25%). was offset by positive conditions lead-
Although growing fast, biological crop ing to recovery in much of Europe;
Sales of all pesticides, including protection products equate to less than a strong ag economy and market in
non-crop products, is estimated to have
risen by 5.8% to $78,193-mn. Sales
Table 1: Global pesticides market
[$ million]
2021 2022 Change
Crop protection 65,206 69,256 +6.2%
Non-crop 8,671 8,937 +3.1%
pesticides
Total 73,877 78,193 +5.8%
Table 2: Global crop protection mar-
ket by region
[$ million]
2021 % change 2022
Asia Pacifi c 21,038 +4.0 21,885
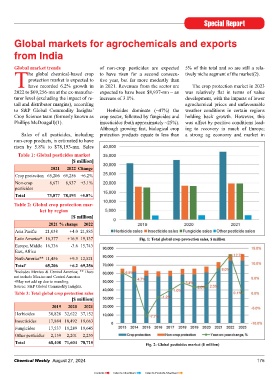
Latin America* 16,377 +16.9 19,137 Fig. 1: Total global crop protection sales, $ million
Europe, Middle 16,336 -3.6 15,743
East, Africa
North America** 11,456 +9.3 12,521
Total + 65,206 +6.2 69,256
*Includes Mexico & Central America; ** Does
not include Mexico and Central America
+May not add up due to rounding.
Source: S&P Global Commodity Insights.
Table 3: Total global crop protection sales
[$ million]
2019 2020 2021
Herbicides 30,828 32,622 37,152
Insecticides 17,884 18,492 19,663
Fungicides 17,537 18,289 19,645
Other pesticides 2,159 2,201 2,255
Total 68,408 71,604 78,715 Fig. 2: Global pesticides market ($ million)
Chemical Weekly August 27, 2024 175
Contents Index to Advertisers Index to Products Advertised