
Page 177 - CW E-Magazine (6-8-2024)
P. 177
Special Report Special Report
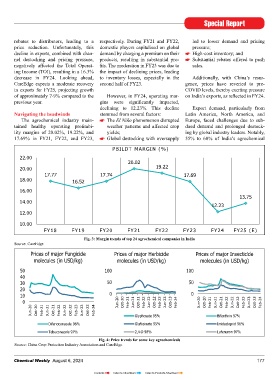
PBILDT MARGIN (%)
22.00
Agrochemicals industry in India: Beyond the grey skies? rebates to distributors, leading to a respectively. During FY21 and FY22, led to lower demand and pricing
20.02
19.22
price reduction. Unfortunately, this domestic players capitalised on global pressure;
20.00
Synopsis decline in exports, combined with chan- demand by charging a premium on their High-cost inventory; and
17.77
17.74
Substantial rebates offered to push
espite the near-term challenges, nel destocking and pricing pressure, products, resulting in substantial pro- 17.69
18.00
the Indian agrochemicals 100 50% negatively affected the Total Operat- fi ts. The moderation in FY23 was due to sales.
16.52
90
Dindustry (excluding fertilisers) 80 40% ing Income (TOI), resulting in a 16.3% the impact of declining prices, leading
16.00
is envisaged to grow by 7-9% in FY25 70 78 69 30% decrease in FY24. Looking ahead, to inventory losses, especially in the Additionally, with China’s resur-
13.75
led by robust domestic demand, import In '000 INR Crores 60 57 68 65 20% CareEdge expects a moderate recovery second half of FY23. gence, prices have reverted to pre-
50
14.00
substitution, adoption of a ‘China+1’ 40 49 10% in exports for FY25, projecting growth COVID levels, thereby exerting pressure
12.23
policy, India’s low-cost manufacturing 30 35 0% of approximately 7-9% compared to the However, in FY24, operating mar- on India’s exports, as refl ected in FY24.
20
12.00
advantage, and opportunities arising 10 -10% previous year. gins were signifi cantly impacted,
from off-patent agrochemical products. 0 -20% declining to 12.23%. This decline Export demand, particularly from
FY19 FY20 FY21 FY22 FY23 FY24 FY25 (E) Navigating the headwinds stemmed from several factors: Latin America, North America, and
10.00
After recording a remarkable Total Sales Exports Domestic Growth in TOI The agrochemical industry main- The El Niño phenomenon disrupted Europe, faced challenges due to sub-
FY21
FY18
FY20
FY19
FY24
FY25 (E)
FY23
FY22
growth in FY22-FY23 driven by Fig. 1: Financials of top 24 agrochemical companies in India tained healthy operating profi tabi- weather patterns and affected crop dued demand and prolonged destock-
exports, FY24 saw a signifi cant 20.3% Source: CareEdge lity margins of 20.02%, 19.22%, and yields; ing by global industry leaders. Notably,
year-on-year decline in exports due to 17.69% in FY21, FY22, and FY23, Global destocking with oversupply 55% to 60% of India’s agrochemical
channel destocking and pricing pres- 30 21
19
sure from China’s re-entry into the 25 17 PBILDT MARGIN (%)
market. To address channel destocking, 20 15 22.00
major exporters offered rebates to distri- 15 13 in % 20.02 19.22
butors, resulting in a price reduction In '000 Crores 10 11 20.00
and pressure on operating profi tability 5 9 7 17.77 17.74 17.69
during FY24. Domestic demand also 0 5 18.00 16.52
saw a decline of 19.3% due to the lower Q1 Q2 Q3 Q4 Q1 Q2 Q3 Q4 Q1 Q2 Q3 Q4 16.00
prices offered by Chinese suppliers and FY22 FY23 FY24 13.75
impact of El Niño. Total Revenue Operating Margin 14.00
Fig. 2: Quarterly trend in revenue of top 24 agrochemical companies in India 12.23
De-stocking began in H2FY24, exer- Source: CareEdge 12.00
ting pressure on sales volumes and by an impressive 28%, followed by After recording impressive dou-
potentially causing price erosion. Higher relatively moderate growth in FY23. ble-digit quarter-on-quarter (Q-o-Q) 10.00
inventory levels amid falling input This positive trend can be attributed to growth up to Q2FY23, revenues have FY18 FY19 FY20 FY21 FY22 FY23 FY24 FY25 (E)
costs led to inventory losses. However, consistent capacity expansion, robust experienced a signifi cant downward Fig. 3: Margin trends of top 24 agrochemical companies in India
with the subsiding of destocking and exports, and steady domestic demand trend. This shift began in Q3FY23 with Source: CareEdge
stability in prices, recovery is expected post-pandemic. Over the period from just 3% Q-o-Q de-growth, followed by
from H2FY25 as input costs and reali- FY21 to FY24, the industry maintained a steeper decline of 27% in Q1FY24 on Prices of major Fungicide Prices of major Herbicide Prices of major Insecticide
sations normalise. a robust compound annual growth rate a Q-o-Q basis. While Q2FY24 showed molecules (in USD/kg) molecules (in USD/kg) molecules (in USD/kg)
(CAGR) of 16%. some signs of recovery, this was short-
Despite the envisaged moderate lived as Q3FY24 brought another set- 50 100 100
revenue growth in FY25, the profi tabi- However, in FY24, exports faced back with a 15% revenue decrease. 40 50 50
lity of the sector is expected to recover; a signifi cant year-on-year decline of Headwinds, both in the domestic and 30
albeit remaining lower than in FY23. 20.36%, dropping from Rs.13,788- the international markets, dragged 20 0 0
The overall credit profi le of companies crore in FY23 to Rs.11,456-crore. This down the industry’s revenues over the 10
operating in the Indian agrochemicals decline was primarily infl uenced by past few quarters. However, with reco- 0 Jun-20 Oct-20 Feb-21 Jun-21 Oct-21 Feb-22 Jun-22 Oct-22 Feb-23 Jun-23 Oct-23 Feb-24 Jun-20 Oct-20 Feb-21 Jun-21 Oct-21 Feb-22 Jun-22 Oct-22 Feb-23 Jun-23 Oct-23 Feb-24
industry is expected to remain stable. channel destocking and pricing pres- very in Q4FY24, led by an improve- Jun-20 Oct-20 Feb-21 Jun-21 Oct-21 Feb-22 Jun-22 Oct-22 Feb-23 Jun-23 Oct-23 Feb-24
sure resulting from China’s re-entry ment in volumes, the industry’s rev- Glyphosate 95% Bifenthrin 97%
Turbulent FY24 after a period into the market. A similar decline of enues are expected to gradually recover Difenoconazole 96% Glufosinate 95% Imidacloprid 96%
of growth around 19.34% was noticed at a domes- in FY25, largely from H2FY25.
India’s agrochemical industry tic level mainly due to cheaper prices Tebuconazole 97% 2,4-D 98% Lufenuron 97%
achieved remarkable growth in FY22 offered to the farmers by Chinese pro- To mitigate the impact of channel Fig. 4: Price trends for some key agrochemicals
Prices of major Herbicide
Prices of major Fungicide
and FY23. In FY22, exports surged ducts and impact of El Niño. destocking, major exporters offered Source: China Crop Protection Industry Association and CareEdge Prices of major Insecticide
molecules (in USD/kg) molecules (in USD/kg) molecules (in USD/kg)
50
176 Chemical Weekly August 6, 2024 Chemical Weekly August 6, 2024 100 100 177
40
30 50 50
20 Contents Index to Advertisers Index to Products Advertised
10 0 0
0 Jun-20 Oct-20 Feb-21 Jun-21 Oct-21 Feb-22 Jun-22 Oct-22 Feb-23 Jun-23 Oct-23 Feb-24 Jun-20 Oct-20 Feb-21 Jun-21 Oct-21 Feb-22 Jun-22 Oct-22 Feb-23 Jun-23 Oct-23 Feb-24
Jun-20 Oct-20 Feb-21 Jun-21 Oct-21 Feb-22 Jun-22 Oct-22 Feb-23 Jun-23 Oct-23 Feb-24 Glyphosate 95% Bifenthrin 97%
Difenoconazole 96% Glufosinate 95% Imidacloprid 96%
Tebuconazole 97% 2,4-D 98% Lufenuron 97%