
Page 197 - CW E-Magazine (8-4-2025)
P. 197
Special Report Special Report
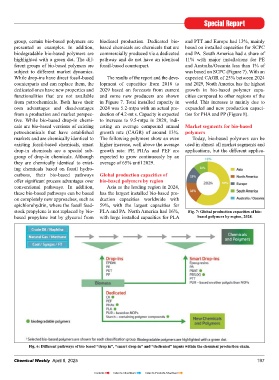
group, certain bio-based polymers are biodiesel production. Dedicated bio- and PTT and Europe had 13%, mainly
presented as examples. In addition, based chemicals are chemicals that are based on installed capacities for SCPC
biodegradable bio-based polymers are commercially produced via a dedicated and PA. South America had a share of
highlighted with a green dot. The dif- pathway and do not have an identical 11% with major installations for PE
ferent groups of bio-based polymers are fossil-based counterpart. and Australia/Oceania less than 1% of
subject to different market dynamics. was based on SCPC (Figure 7). With an
While drop-ins have direct fossil-based The results of the report and the deve- expected CAGR of 25% between 2024
counterparts and can replace them, the lopment of capacities from 2018 to and 2029, North America has the highest
dedicated ones have new properties and 2029 based on forecasts from current growth in bio-based polymer capa-
functionalities that are not available and some new producers are shown cities compared to other regions of the
from petrochemicals. Both have their in Figure 7. Total installed capacity in world. This increase is mainly due to
own advantages and disadvantages 2024 was 5.2-mtpa with an actual pro- expanded and new production capaci-
from a production and market perspec- duction of 4.2-mt s. Capacity is expected ties for PHA and PP (Figure 8).
tive. While bio-based drop-in chemi- to increase to 9.5-mtpa in 2029, indi-
cals are bio-based versions of existing cating an average compound annual Market segments for bio-based
petrochemicals that have established growth rate (CAGR) of around 13%. polymers
markets and are chemically identical to The following polymers show an even Today, bio-based polymers can be
existing fossil-based chemicals, smart higher increase, well above the average used in almost all market segments and
drop-in chemicals are a special sub- growth rate: PP, PHAs and PEF are applications, but the different applica-
group of drop-in chemicals. Although expected to grow continuously by an
they are chemically identical to exist- average of 65% until 2029.
ing chemicals based on fossil hydro-
carbons, their bio-based pathways Global production capacities of
offer signifi cant process advantages over bio-based polymers by region
conventional pathways. In addition, Asia as the leading region in 2024,
these bio-based pathways can be based has the largest installed bio-based pro-
on completely new approaches, such as duction capacities worldwide with
epichlorohydrin, where the fossil feed- 59%, with the largest capacities for
stock propylene is not replaced by bio- PLA and PA. North America had 16%, Fig. 7: Global production capacities of bio-
based propylene but by glycerol from with large installed capacities for PLA based polymers by region, 2024.
Fig. 5: All (semi-)commercial pathways from biomass via different intermediates and building blocks to bio-based polymers.
policy landscape for bio-based poly- are composed of the polymers that will are made from bio-based resources,
mers is constantly evolving, it does later form the structural mass of the fi ni- 51% and 9%, respectively.
so not yet provide a consistent policy shed plastic part, which is covered in
framework that suffi ciently incentivises detail in this report and the bio-based All (semi) commercial pathways
the benefi ts, properties and applications linoleum part. Together, they total 4.3-mt. from biomass via different intermedi-
of bio-based polymers – unlike other On the other hand, the total amount ates and building blocks to bio-based
regions of the world. of bio-based functional polymers con- polymers are shown in Figure 5. Bio-
sists of bio-based functional polymers based building blocks and polymers are
Bio-based polymers – the highlights and paper starch, giving 13.7-mt. In analysed in detail within the report and
The global polymer market includes addition to these two groups, which highlighted in bold.
functional and structural polymers, rub- account for 18-mt of bio based func-
ber products as well as man made fi bres tional and structural polymers, rubber The different pathways of bio based
(Figure 4). This report focuses on the products and man made fi bres can also “drop in”, “smart drop in” and “dedicated”
bio-based share of the structural poly- be bio based. In total, 15-mt of rubber inputs within the chemical production
mers. Bio-based structural polymers products and 7.8-mt of man-made fi bres chain are shown in Figure 6. For each Fig. 6: Different pathways of bio based “drop in”, “smart drop in” and “dedicated” inputs within the chemical production chain.
196 Chemical Weekly April 8, 2025 Chemical Weekly April 8, 2025 197
Contents Index to Advertisers Index to Products Advertised