
Page 135 - CW E-Magazine (20-8-2024)
P. 135
Point of View
Chemical industry rewarding to investors, even
if valuations are off highs
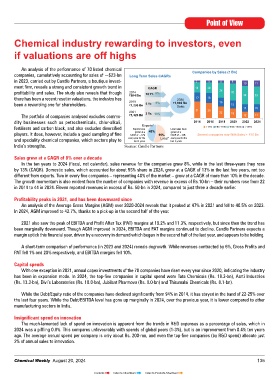
An analysis of the performance of 70 listed chemical
companies, cumulatively accounting for sales of ~$23-bn Long Term Sales CAGRs Companies by Sales (` Bn)
in 2023, carried out by Candle Partners, a boutique invest- 3 3 4 5 10 11
ment firm, reveals a strong and consistent growth trend in CAGR 19 20
profitability and sales. The study also reveals that though 2014 10 Yr. 8% 28 32 34
there has been a recent reset in valuations, the industry has `894 Bn 2024 17 18 33
been a rewarding one for shareholders. 2019 5 Yr. 9% `1,892 Bn 16 15
`1,239 Bn
Sales
2021 31 29 22 18 14 15
The portfolio of companies analysed excludes commo- `1,326 Bn 3 Yr. 13% 12 11
dity businesses such as petrochemicals, chlor-alkali, 2014 2016 2018 2020 2022 2024
Exports*
fertilisers and carbon black, and also excludes diversified Exports have Local sales have < 5 Bn 5 Bn - 10 Bn 10 Bn - 50 Bn > 50 Bn
grown at a
players. It does, however, include a good sampling of fine CAGR of ~12% 45% 55% grown at a Several companies now With Sales > `10 Bn
CAGR of ~13%
and speciality chemical companies, which sectors play to every year for the Local* every year for the
last 5 years
last 5 years
India’s strengths. Source: Candle Partners
Sales grew at a CAGR of 8% over a decade
In the ten years to 2024 (fiscal, not calendar), sales revenue for the companies grew 8%, while in the last three-years they rose
by 13% (CAGR). Domestic sales, which accounted for about 55% share in 2024, grew at a CAGR of 13% in the last five years, not too
different from exports. Two in every five companies – representing 40% of the market – grew at a CAGR of more than 10% in the decade.
The growth momentum is also evident from the number of companies with revenue in excess of Rs.10-bn – their numbers rose from 22
in 2014 to 44 in 2024. Eleven reported revenues in excess of Rs. 50-bn in 2024, compared to just three a decade earlier.
Profitability peaks in 2021, and has been downward since
An analysis of the Average Gross Margins (AGM) over 2020-2024 reveals that it peaked at 47% in 2021 and fell to 40.5% on 2023.
In 2024, AGM improved to 42.7%, thanks to a pick-up in the second half of the year.
2021 also saw the peak of EBITDA and Profit After Tax (PAT) margins at 19.2% and 11.3%, respectively, but since then the trend has
been marginally downward. Though AGM improved in 2024, EBITDA and PAT margins continued to decline. Candle Partners expects a
margin uptick this financial year, driven by a recovery in demand which began in the second half of the last year, and appears to be holding.
A short-term comparison of performance (in 2023 and 2024) reveals degrowth. While revenues contracted by 6%, Gross Profits and
PAT fell 1% and 20% respectively, and EBITDA margins fell 10%.
Capital spends
With one exception in 2021, annual capex investments of the 70 companies have risen every year since 2020, indicating the industry
has been in expansion mode. In 2024, the top-five companies in capital spend were Tata Chemicals (Rs. 18.3-bn), Aarti Industries
(Rs. 13.3-bn), Divi’s Laboratories (Rs. 10.0-bn), Jubilant Pharmova (Rs. 9.0-bn) and Thirumalai Chemicals (Rs. 8.1-bn).
While the Debt/Equity ratio of the companies have declined significantly from 94% in 2014, it has stayed in the band of 22-25% over
the last four years. While the Debt/EBITDA level has gone up marginally in 2024, over the previous year, it is lower compared to other
manufacturing sectors in India.
Insignificant spend on innovation
The much-lamented lack of spend on innovation is apparent from the trends in R&D expenses as a percentage of sales, which in
2024 was a piffling 0.8%. This compares unfavourably with spends of global peers (1-3%), but is an improvement from 0.4% ten years
ago. The average annual spend per company is only about Rs. 200-mn, and even the top-five companies (by R&D spend) allocate just
2% of annual sales to innovation.
Chemical Weekly August 20, 2024 135
Contents Index to Advertisers Index to Products Advertised